Multi RS19 Solar

Overview page

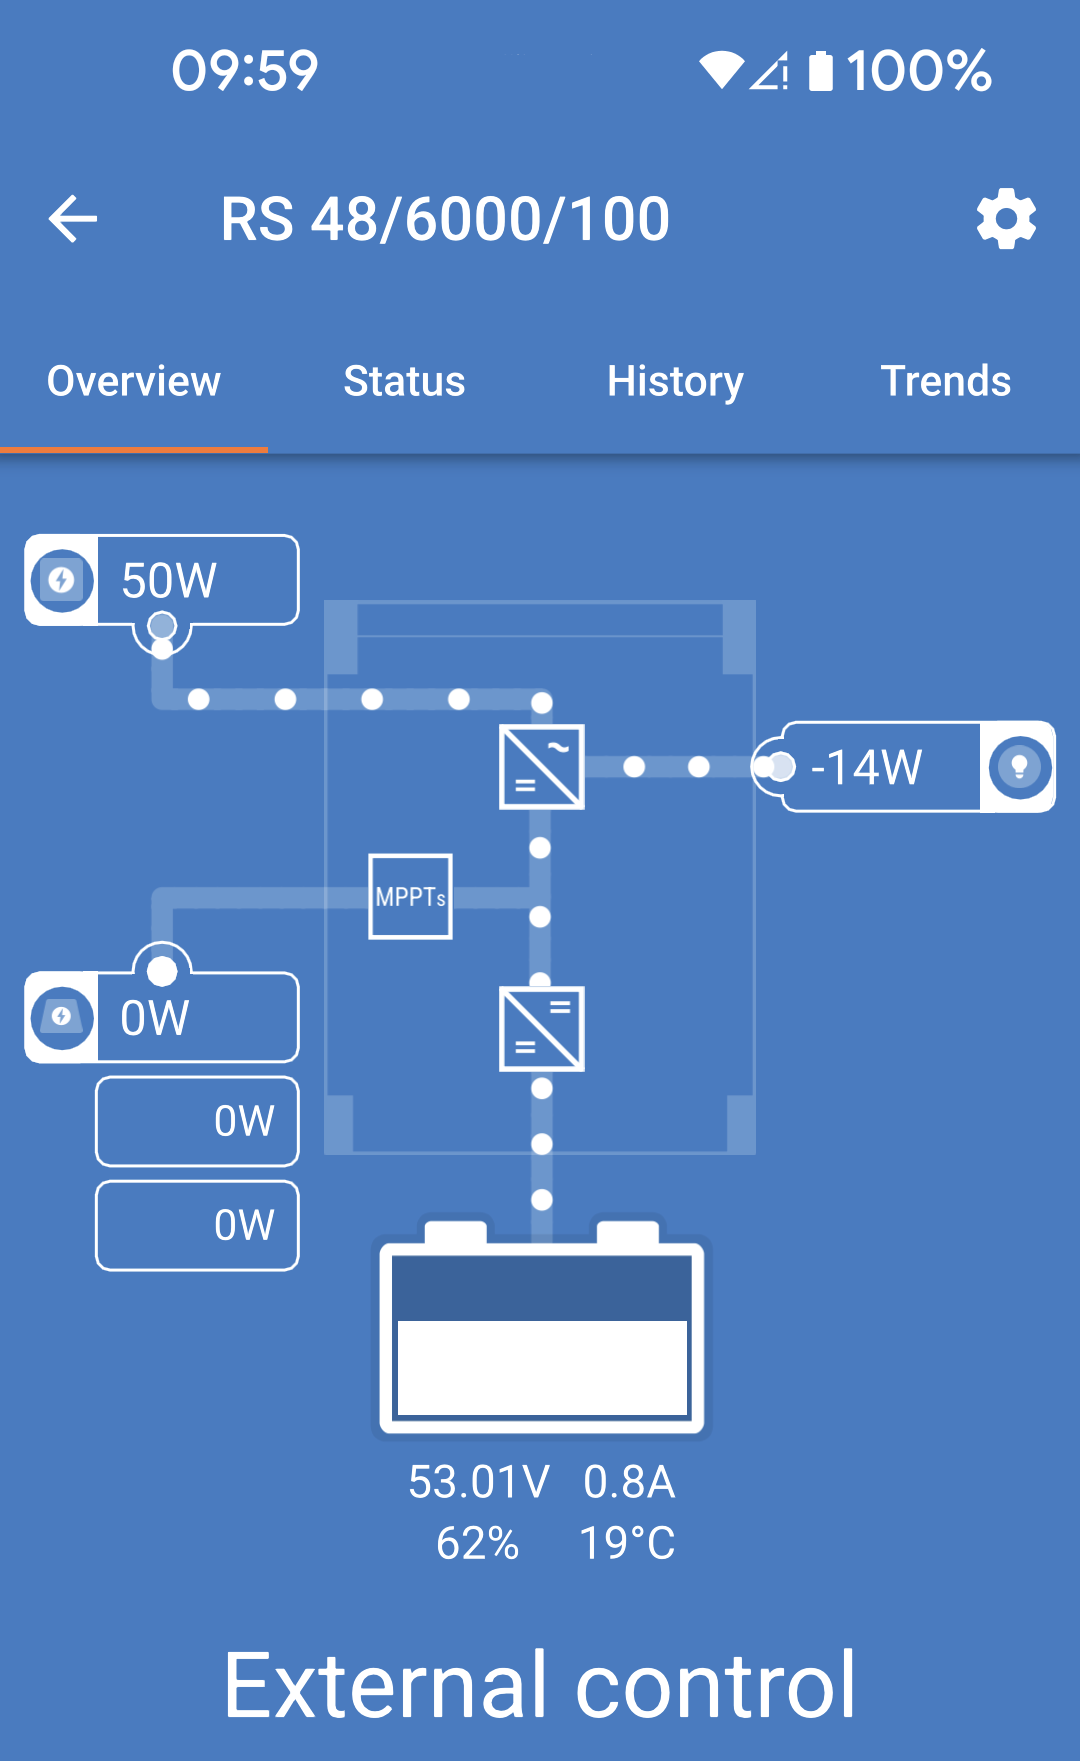
The main overview page provides at-a-glance information of the Multi RS19 Solar. It is divided into four tabs:

  • Overview: Instant readout of the basic state of the solar power yield, AC input and AC output.

  • Status: Instant readout of the basic state of the MPPT charger.

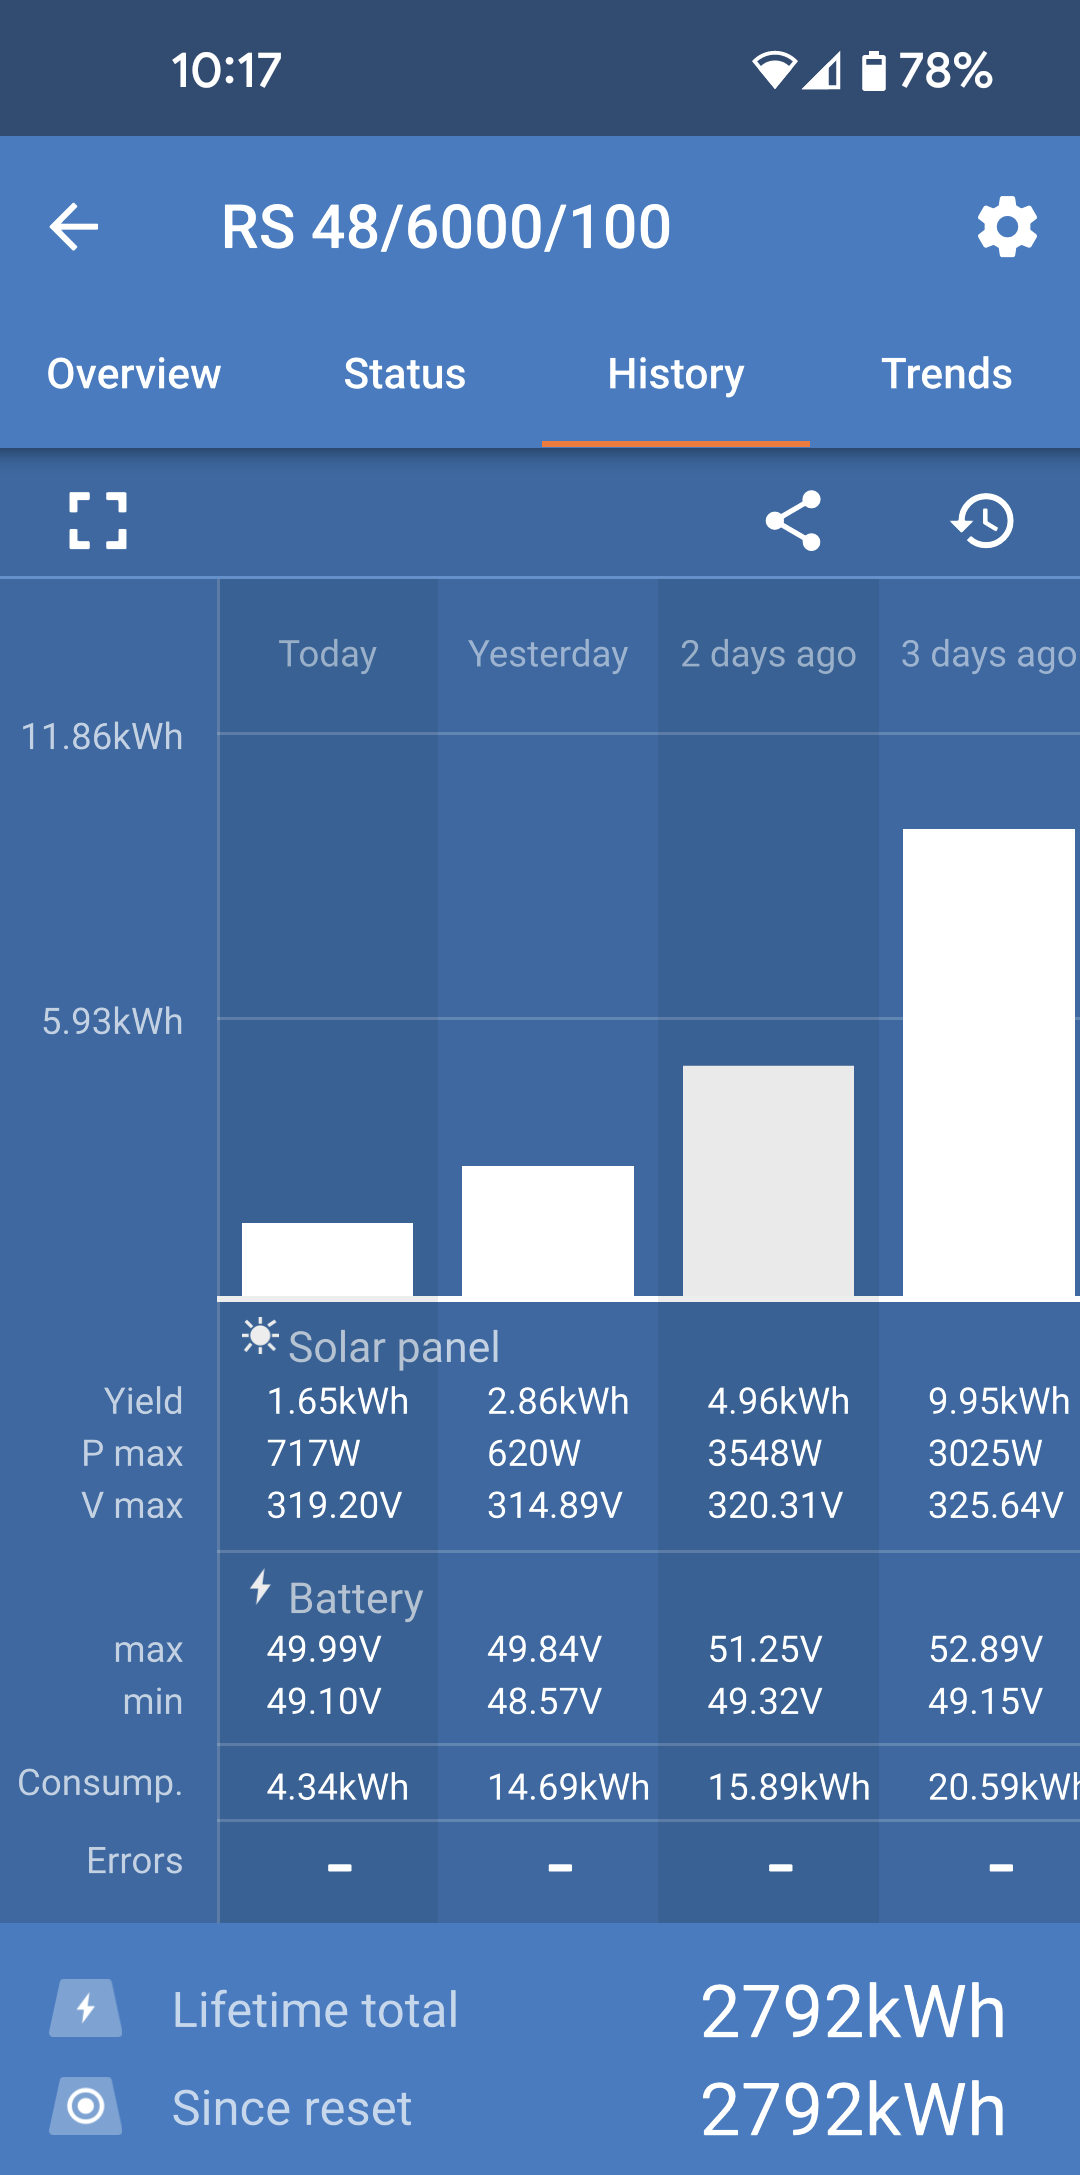
  • History: View up to the last 30 days of solar and battery data.

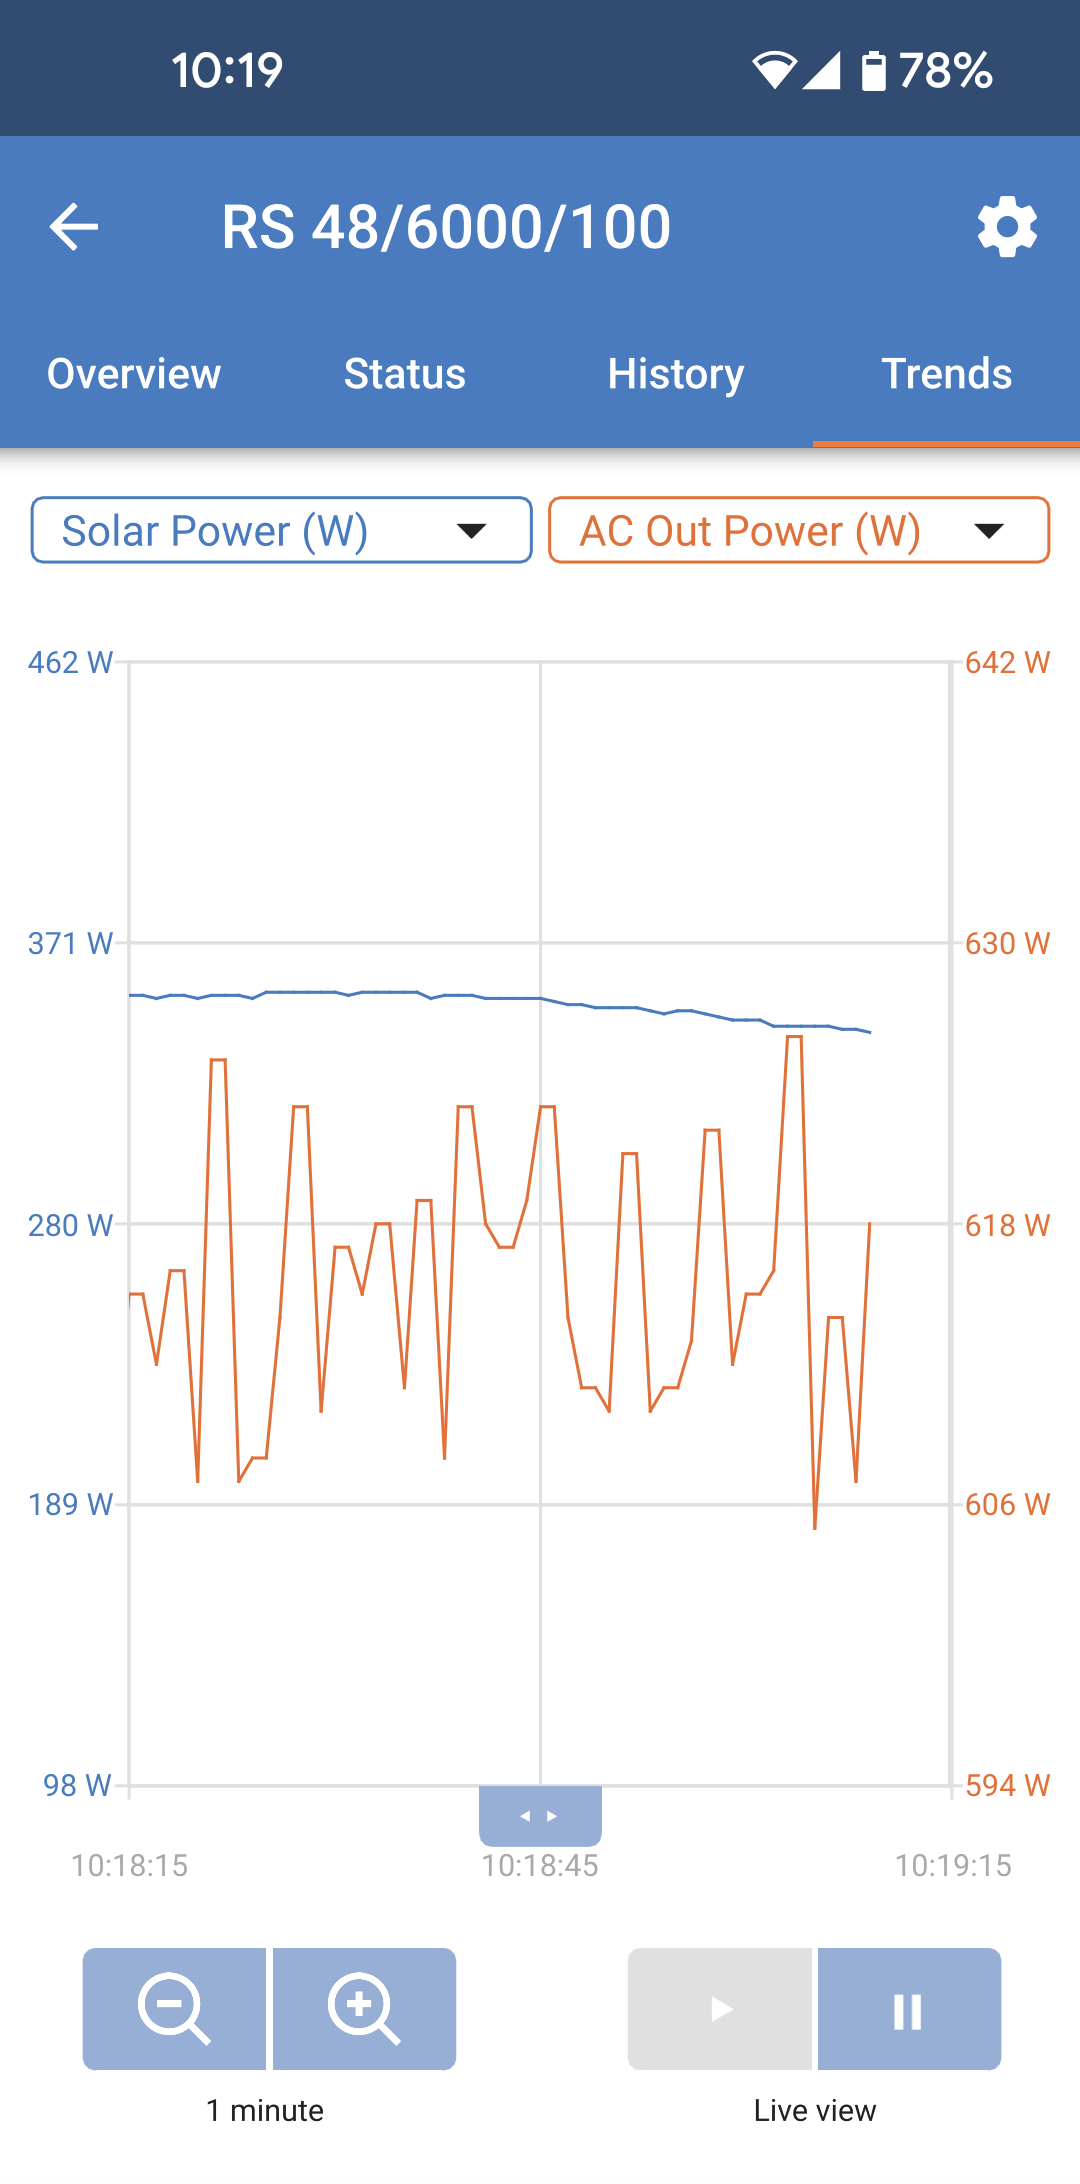
  • Trends: Review current trend data.

Overview:

  • AC input: The top left icon displays the AC input power. A negative value means that power is being exported to the grid.

  • Solar: This shows the total amount of PV power being produced.

    In case of more than one MPPT tracker then the power produced by each tracker will also be displayed.

  • AC output: The AC output power is displayed.

  • Battery: Below the battery graphic, the voltage, current and state of charge are shown.

MultiRS_Overview.png

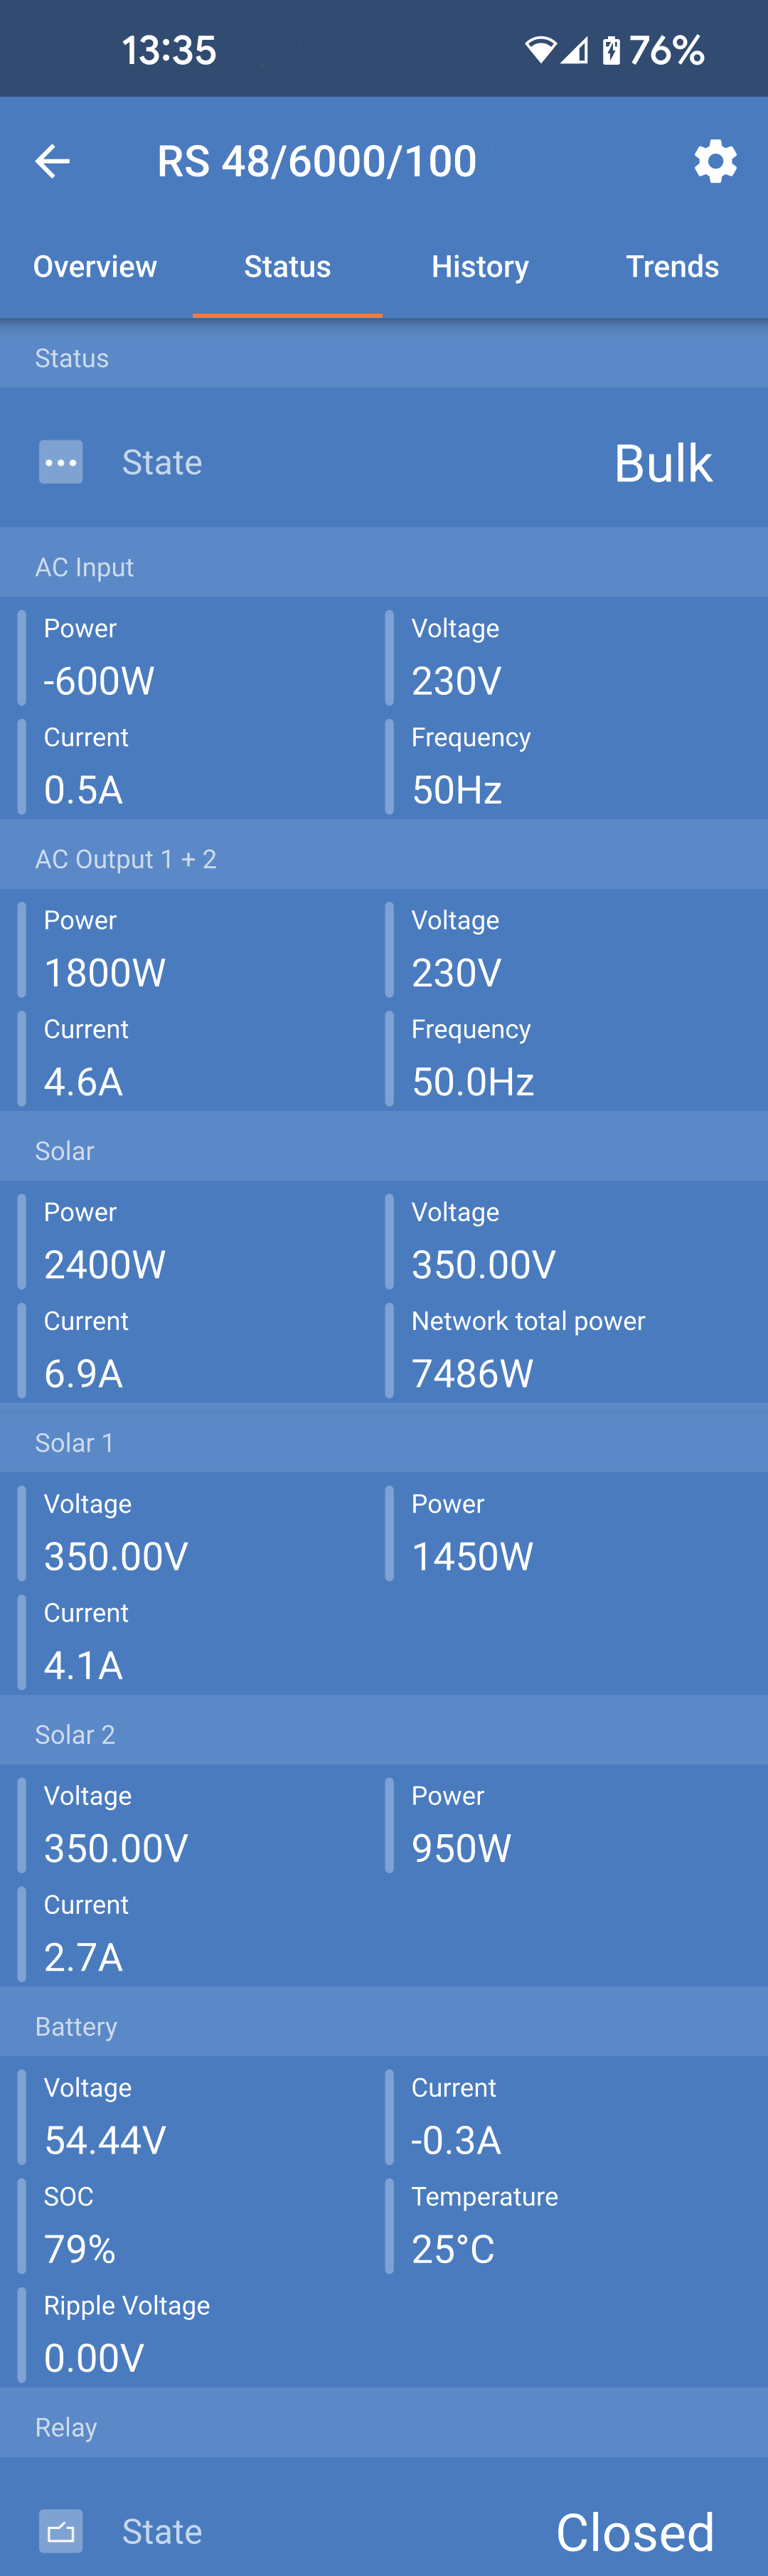
Status tab:

The status tab provides more detailed information than the overview tab.

  • AC Input: AC input power, current, voltage and frequency are shown. Negative values indicate that power is being exported.

  • AC Output 1: Shows the power, current, voltage and frequency at the AC output.

  • AC Output 2: This shows the same parameters as the AC output 1.

  • Solar: Displays the PV power, current and voltage of each tracker in this device.

    Additionally, the total PV power of all MPPT trackers connected to the same VE.Can network are displayed.

  • Solar 1: The voltage, current and power of the first built-in MPPT tracker.

  • Solar 2: The volatge, current and power of the second buit-in MPPT tracker.

  • Battery: The battery voltage, State Of Charge (SOC), current and DC ripple voltage are displayed.

  • Relay: The status of the relay contacts is shown. If the relay mode is set to manual, then the relay can also be controlled here by tapping on the status dropdown at the right.

MultiRS_Status.png

More detailed state information:

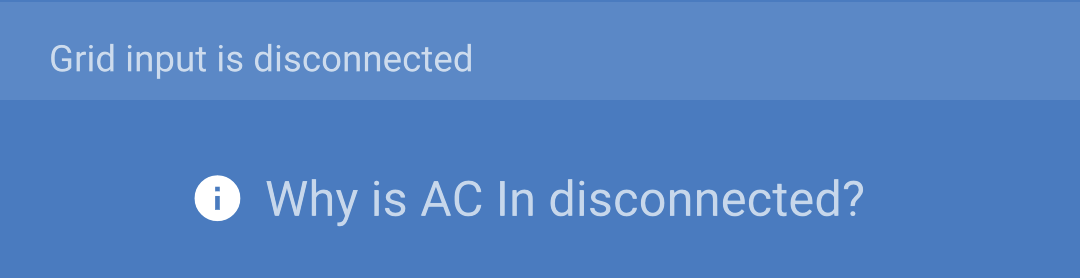
In case the Multi RS19 Solar has a problem, then a reason may be provided alongside an exclamation symbol. In this example "Why is AC in disconnected?"

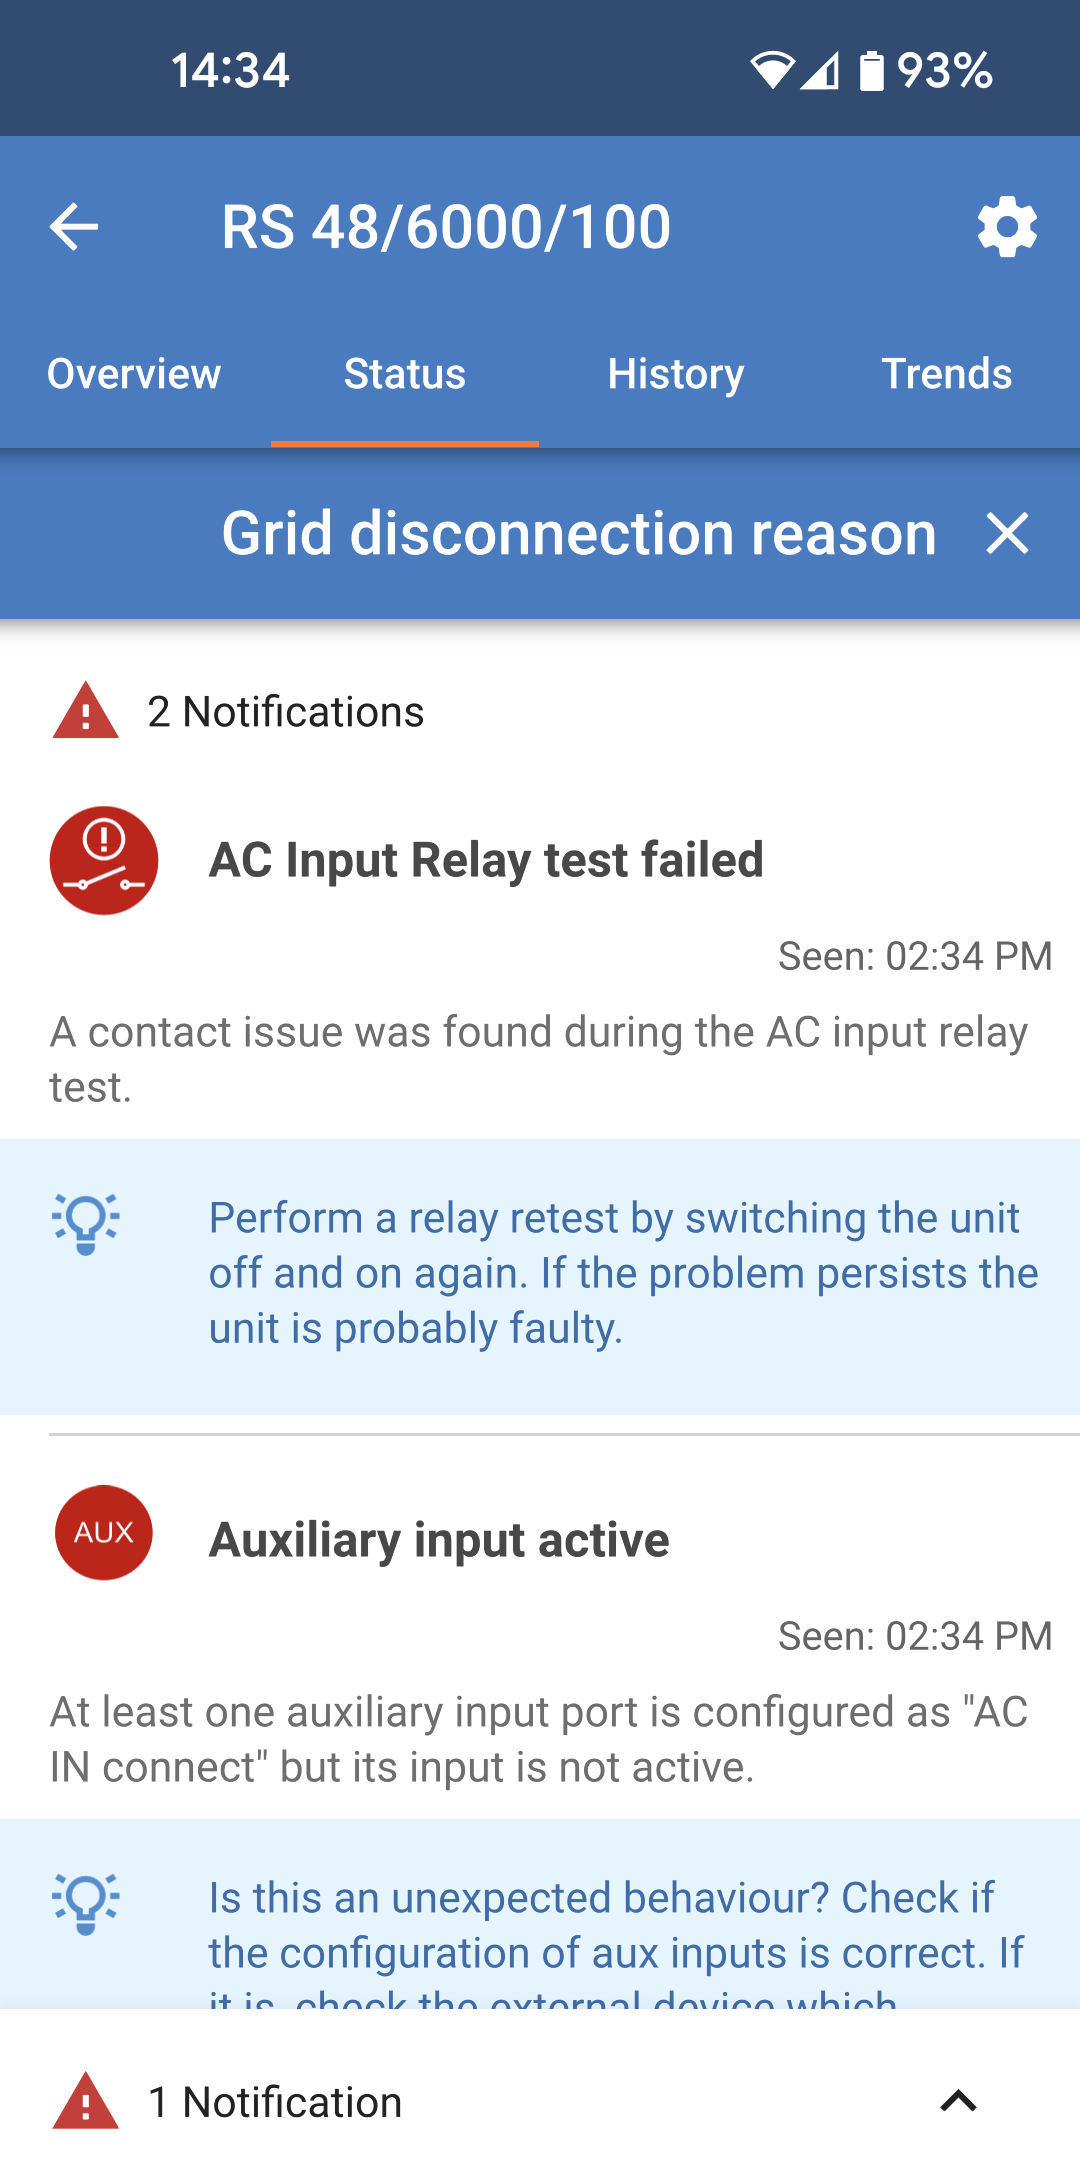
Tap this information field to bring up a popup window which will provide more information and some troubleshooting tips.

MultiRS_Why_AC_disconnected.png
MultiRS_Errors_page.png

History tab:

  • Up to 30 days of historic data is displayed.

  • Bar graphs show the solar yield in kWh. The shaded areas highlight the time spend in the different charging stages.

  • The "Solar panel" area records the total solar yield in kWh, maximum PV power and voltage.

  • Maximum and minimum battery voltages are stored in the "Battery" section.

  • If any errors were raised that day then they are shown with an orange circle.

  • Total energy consumption for the day is totalled in kWh.

  • Lifetime total energy produced by the connected Multi RS19 Solar. The totals can be reset and so "Since reset" keeps the record yield since then.

  • To export the graph as a .csv you can tap the triangular three dot icon at the top of the graph area. You'll then be presented with various methods by which to share the .csv (e.g. email, WhatsApp etc.).

Tip

Tap the fragmented square icon in the top left of the graph area to rotate the graph. This will allow you to see a wide view of the graph with more days displayed at once.

MultiRS_History.png

Trends tab:

  • Two different data points can be selected using the drop down menus just above the graph.

  • A graph will be rendered according to the selected parameters.

MultiRS_Trends.png