3. VRM Portal - Dashboard
3.1. Introduction
The dashboard is the main page. It shows all information about the installation at a glance.
3.1.1. Introduction video
3.2. Example screenshot for yacht installation
 |
3.3. Example screenshot for ESS installation
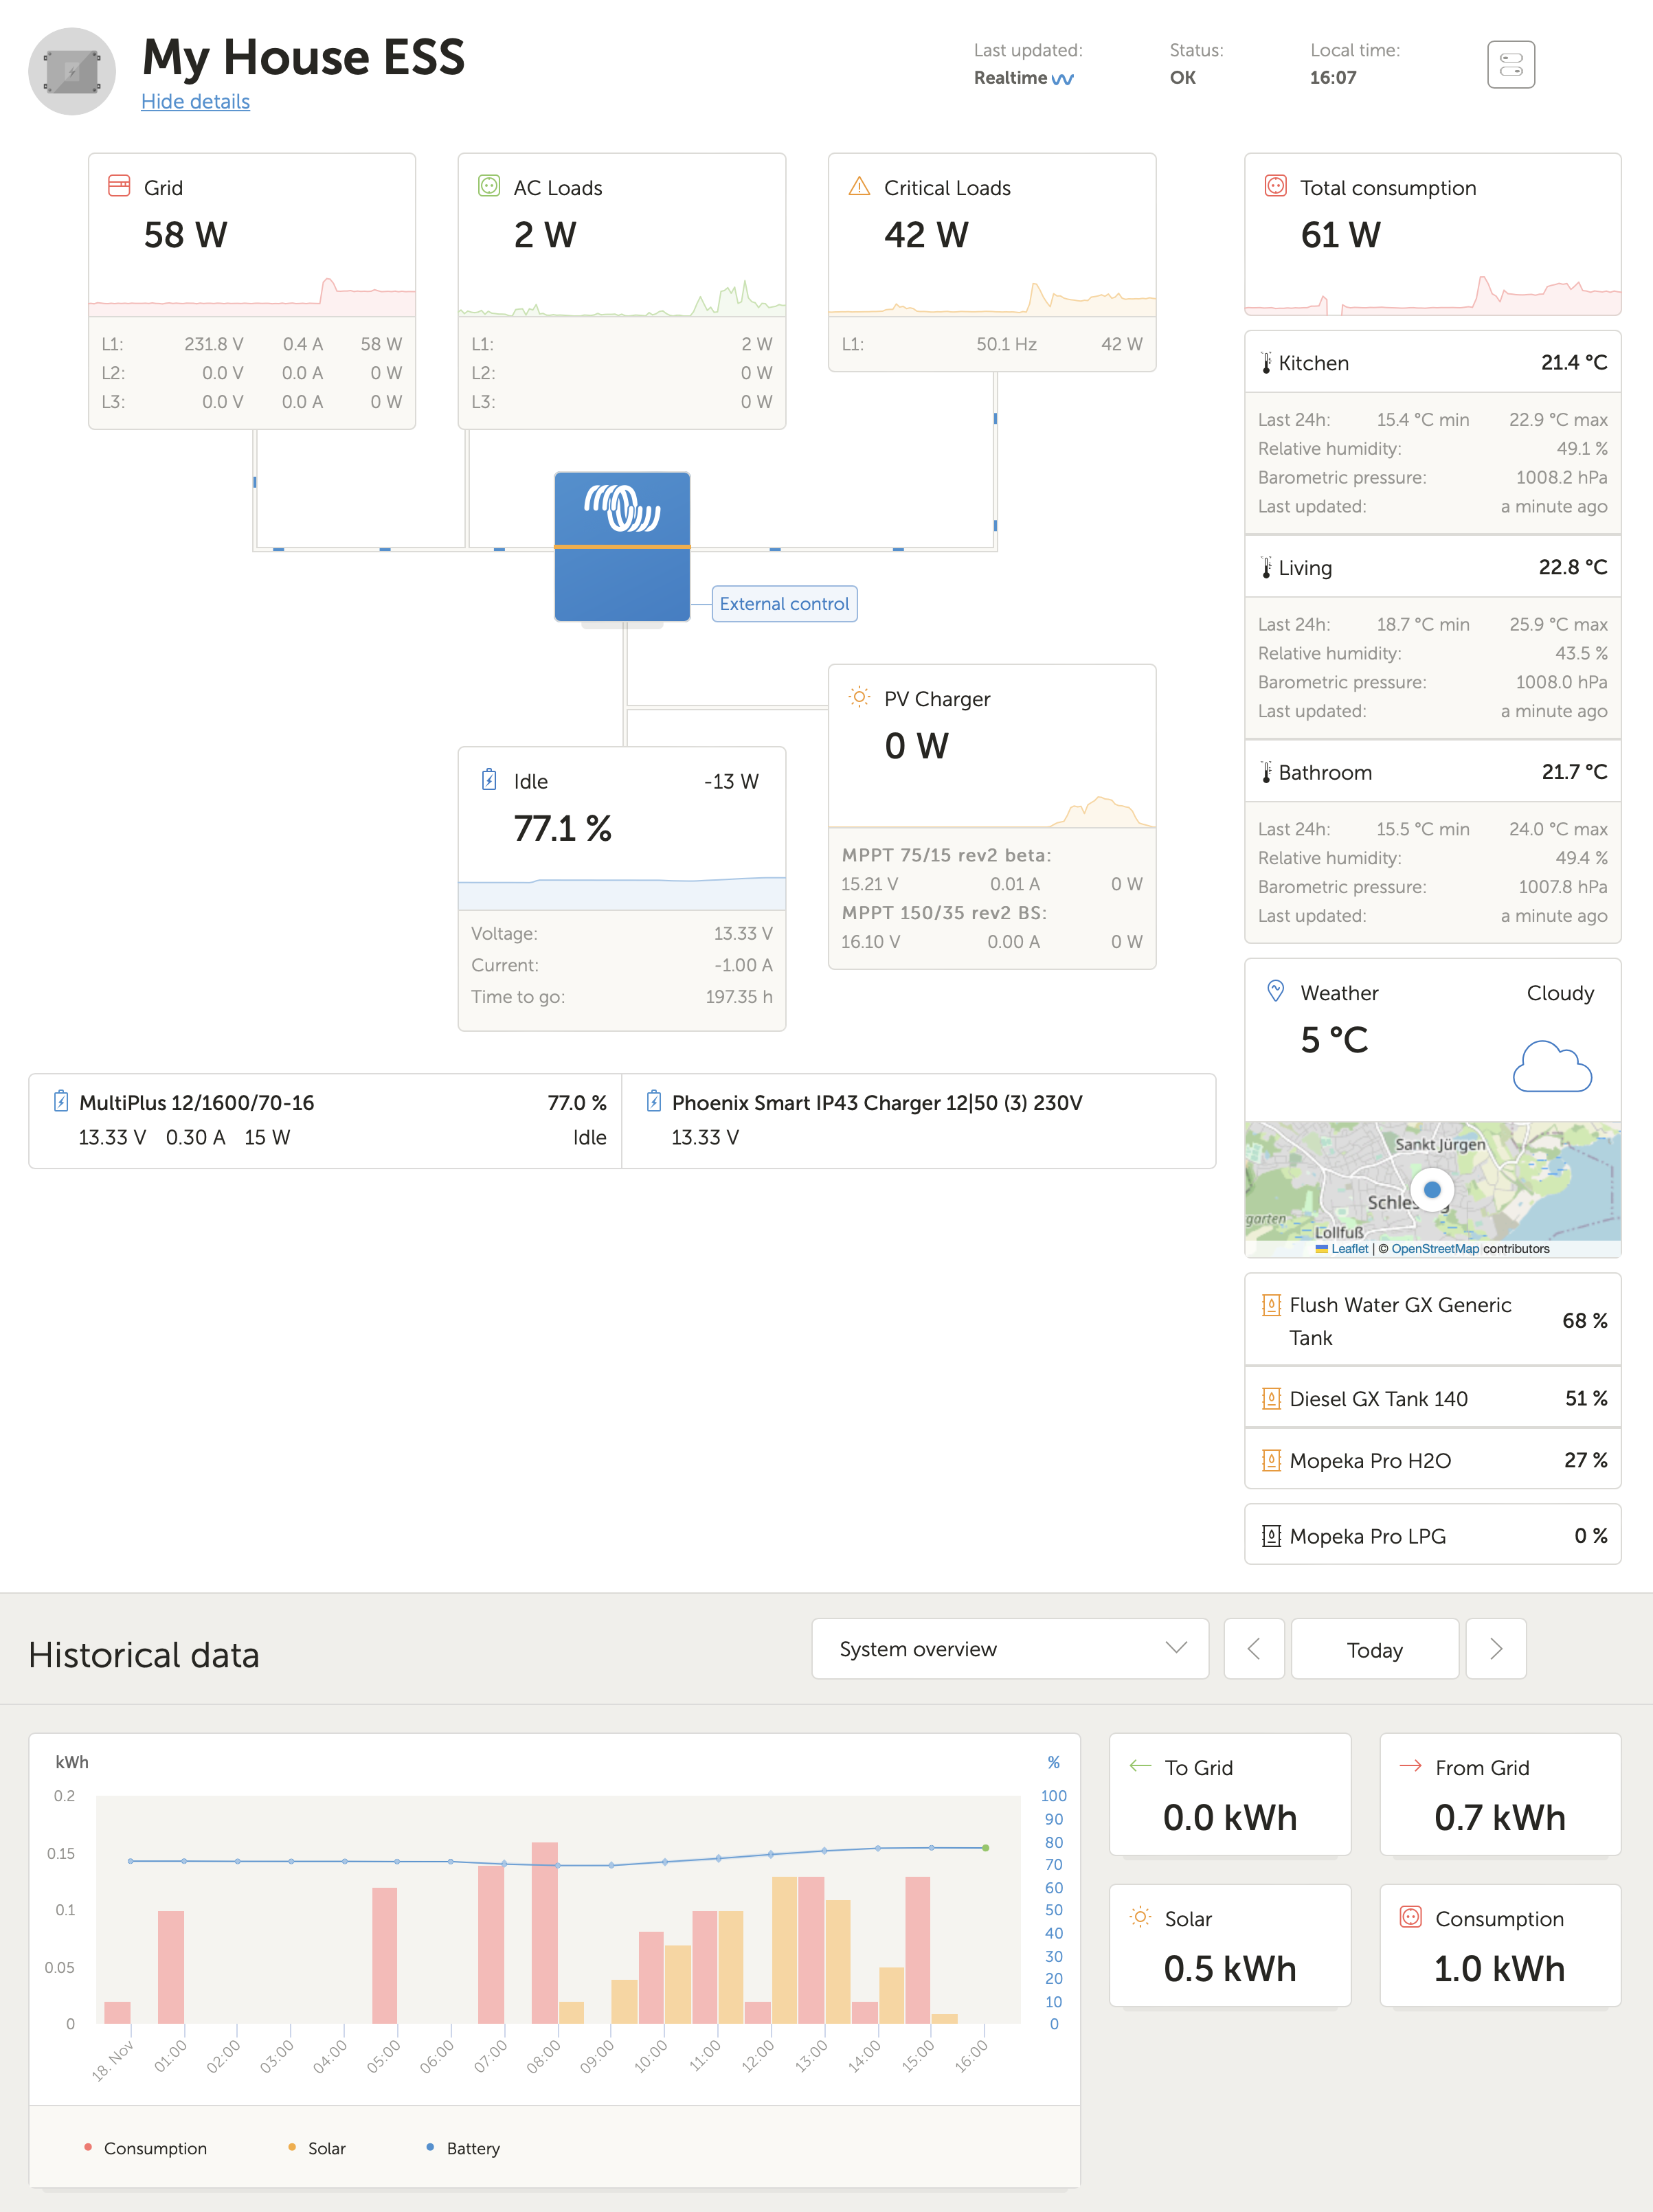 |
3.4. Example screenshot for off-grid installation
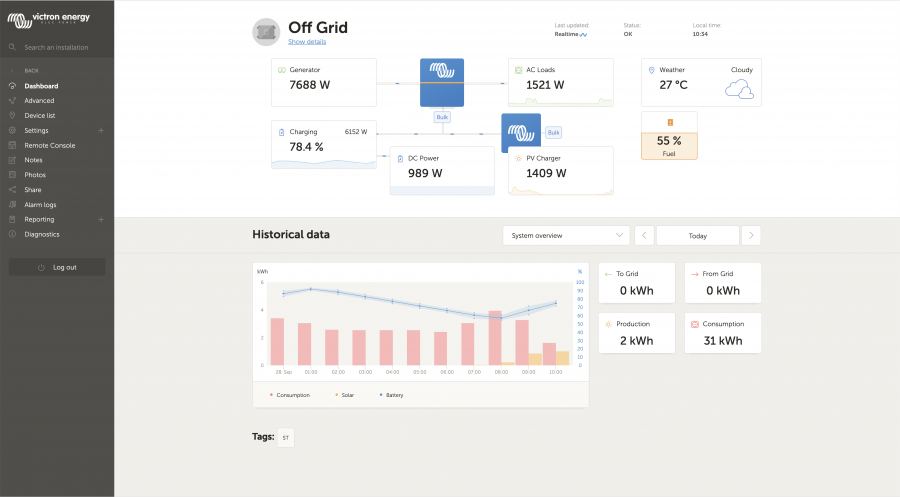 |
3.5. Details per section
3.5.1. Schematic visualisation
The information shown adapts itself to the system installed. VRM is designed to perform best for systems with a Victron Inverter/Charger, for systems without an inverter/charger, you may see some variations from this layout.
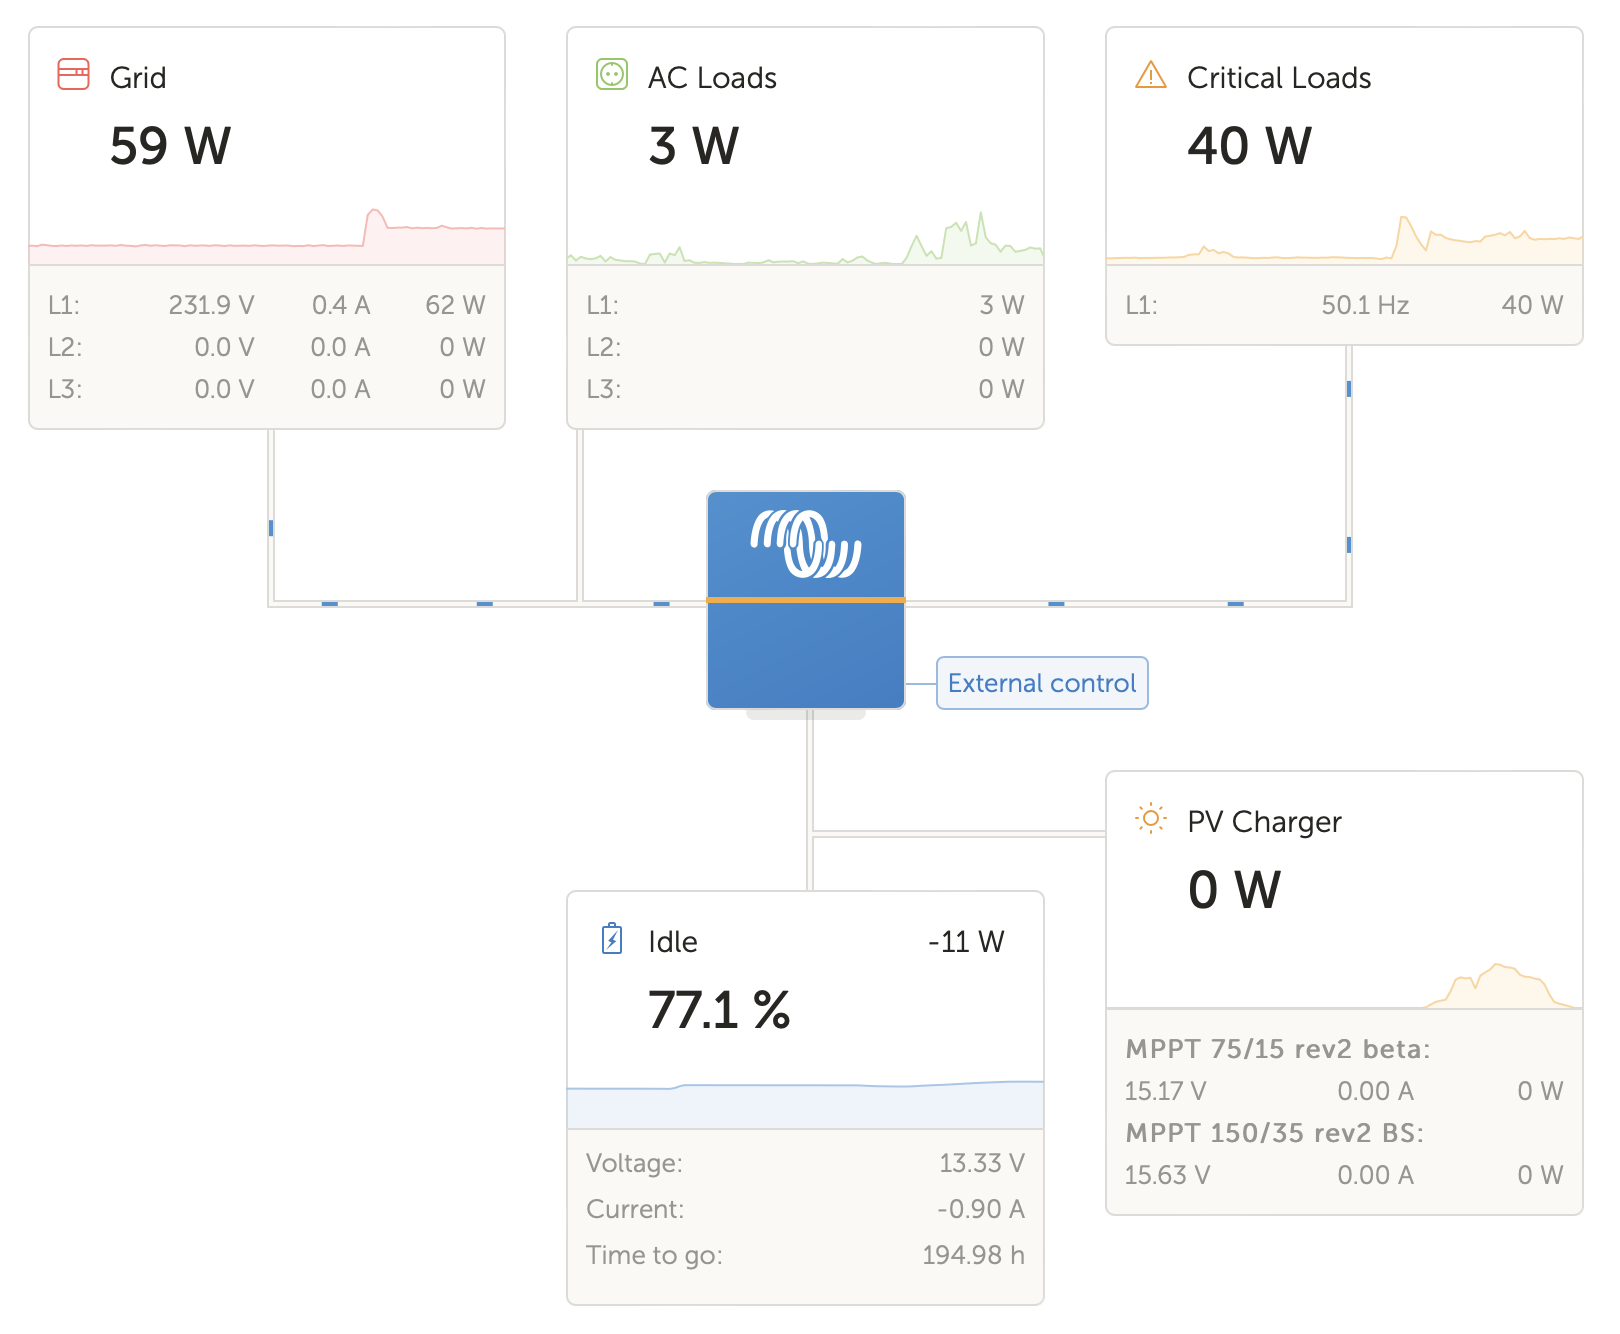 |
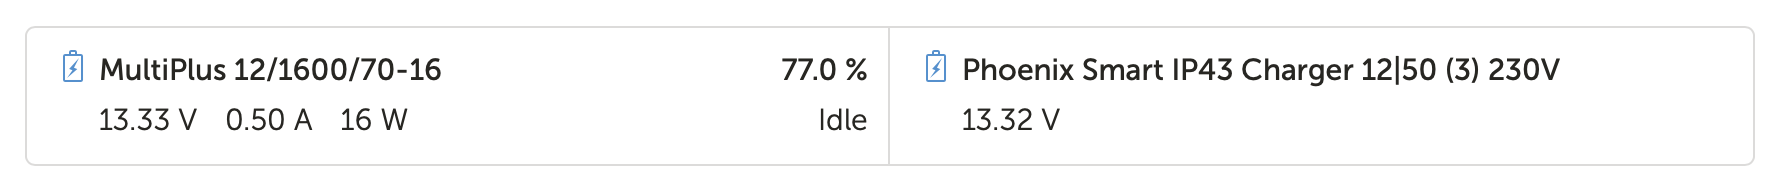
3.5.2. Battery block
The purpose of this part of the dashboard is to show all available batteries for installations having multiple batteries. For example, a yacht with two main engines (and thus two starter batteries), another starter battery for a generator and two service batteries.
For each of the configured batteries, the VRM Portal will show its name, the voltage, current and state of charge.
Configuration:
Configure the battery settings on the GX Device, in the Menu → Settings → System setup → Battery Measurements.
Meet all the requirements for the Realtime feature, as this information is only available when in Realtime mode.
Two or more batteries must be configured. If there is just one, then the information is already shown as part of the main system overview.
The Battery Measurement configuration menu:
It lists all available battery measurements including battery monitors, but also a simple voltage measurement by a solar charger or battery charger for example. For a three-output charger, it will list all three measured voltages.
The GX device allows the following configuration of the available batteries:
Show or hide the battery on the dashboard.
Give the battery a custom name instead of the default device name.
Screenshot from the Remote Console of the detailed menu with a 3-output AC charger (only output 3 is visible), Lynx Smart BMS and a MultiPlus:
 |
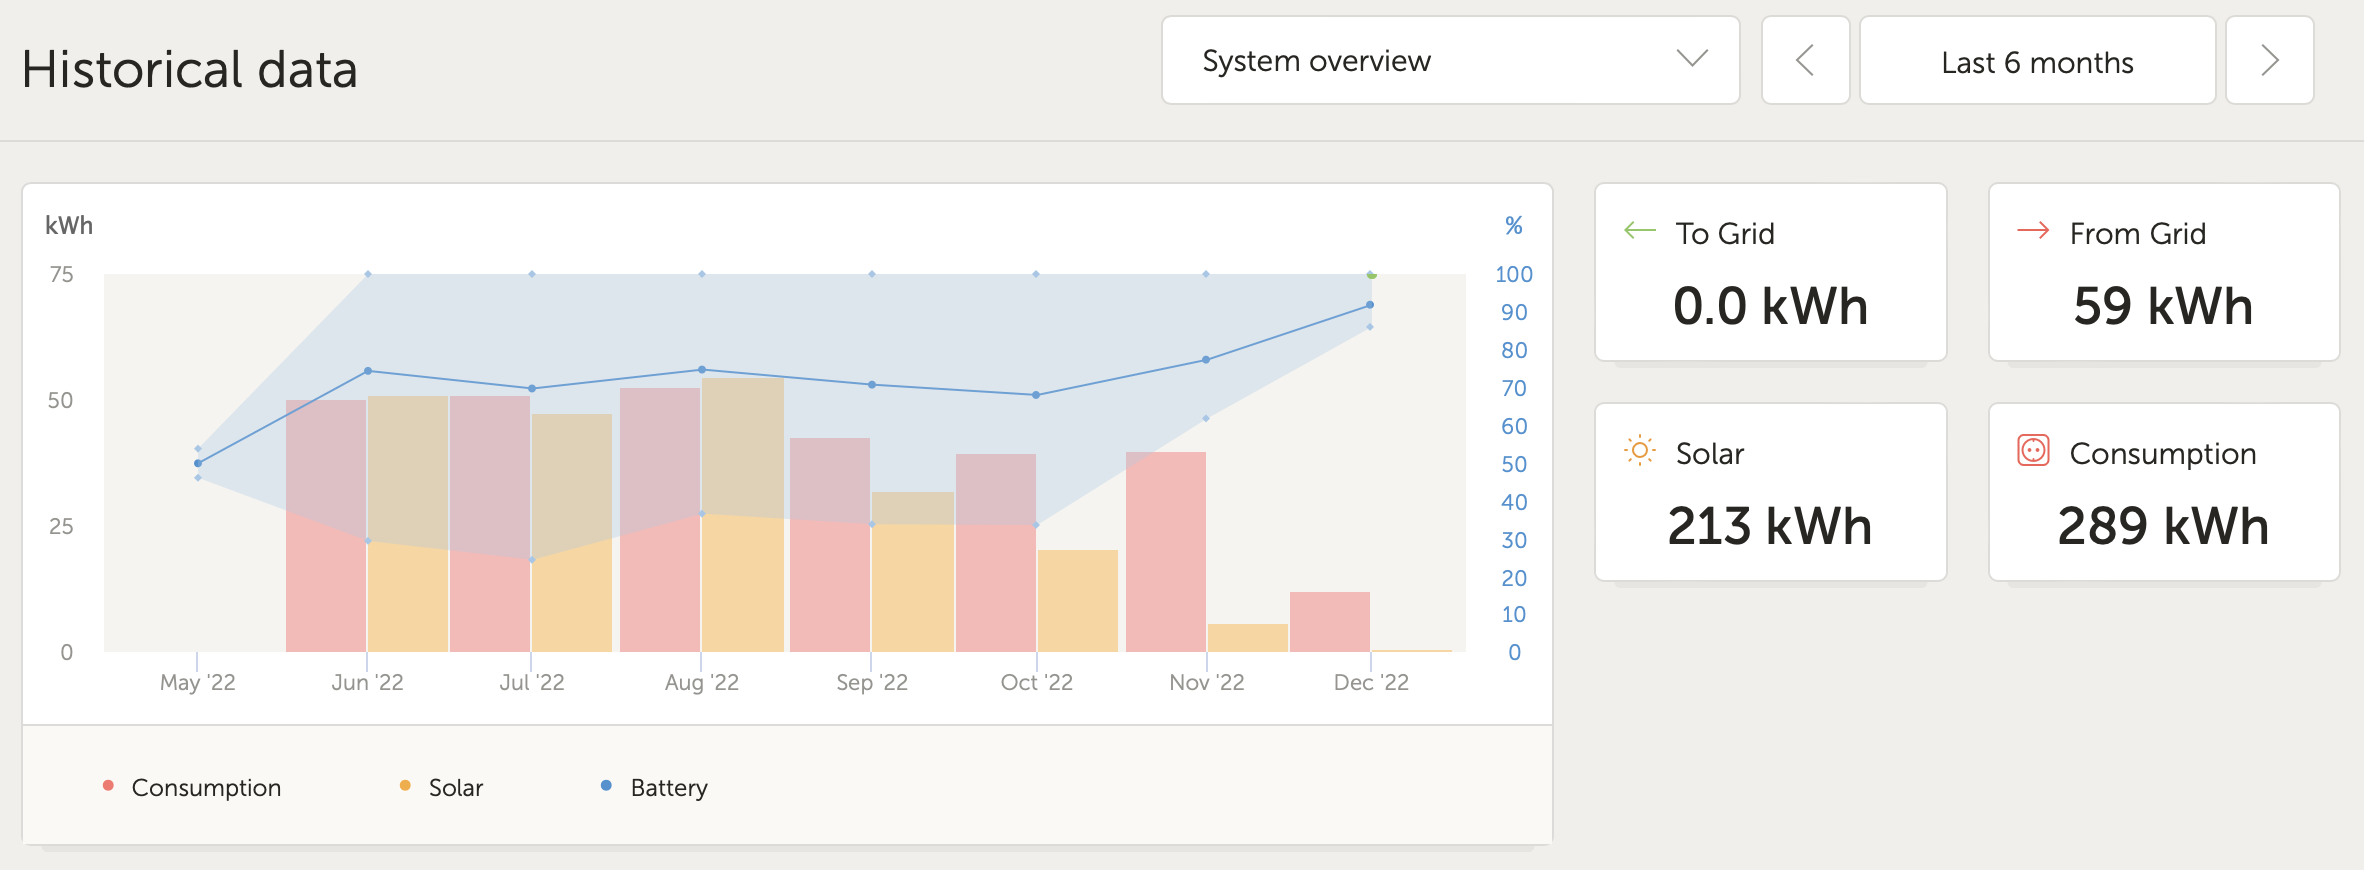
3.5.3. Historical data
Depending on available information, this block will show a bar graph for kWh production and consumption, together with a blue line showing state of charge.
 |
In case that information is not available, it will show a line diagram. The parameters used in the line diagram depend on the products installed:
Battery monitor (BMV, SmartShunt or similar): Voltage on the left axis and SOC on the right axis.
Phoenix Inverter: Output power on the left axis, Battery voltage on the right axis.
Solar Charger: Output power on the left axis, Battery voltage on the right axis.
Requirements for the kWh production and consumption data are explained in the VRM Portal - Frequently asked questions chapter.
Screenshot of an installation with only a Phoenix Inverter, and thus showing the line diagram:
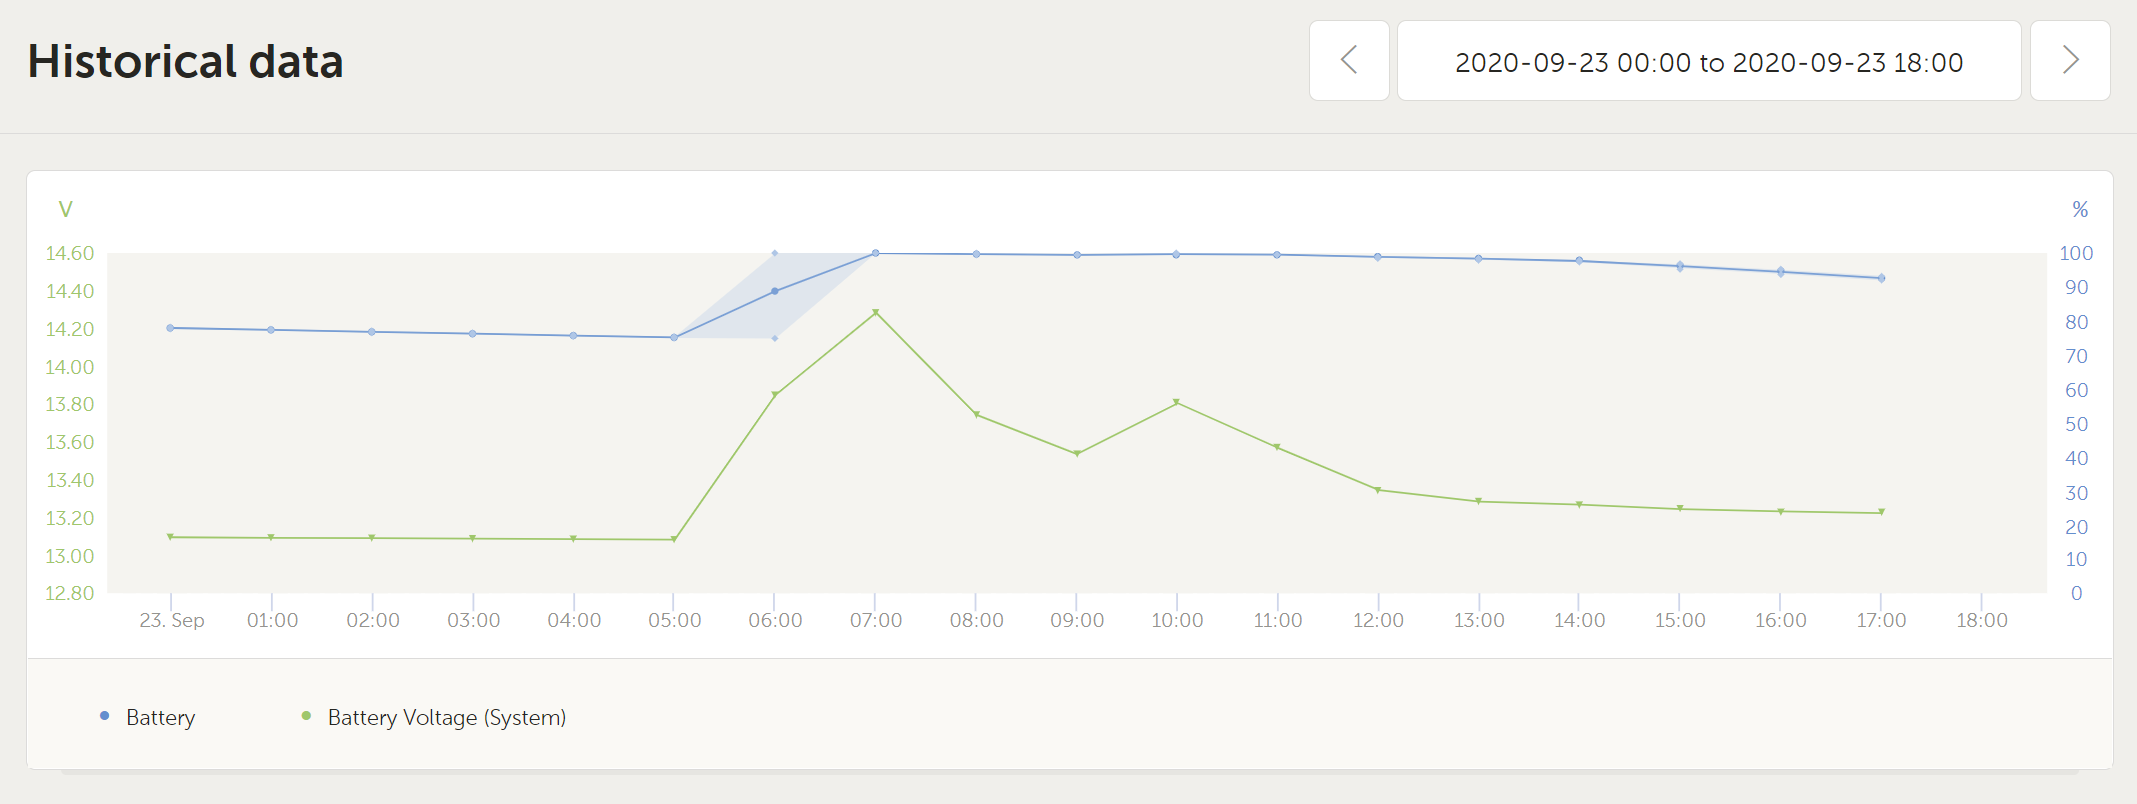 |
3.5.4. Solar production forecast
This feature combines a model of your sites solar production potential with irradiance forecasting data from Solcast's global fleet of weather satellites.
Getting started
Existing installations with a solar history and location set can show their solar forecast immediately.
To see the solar forecast, open your site VRM dashboard and select ‘Today’. This should reveal a Show/Hide forecast button.
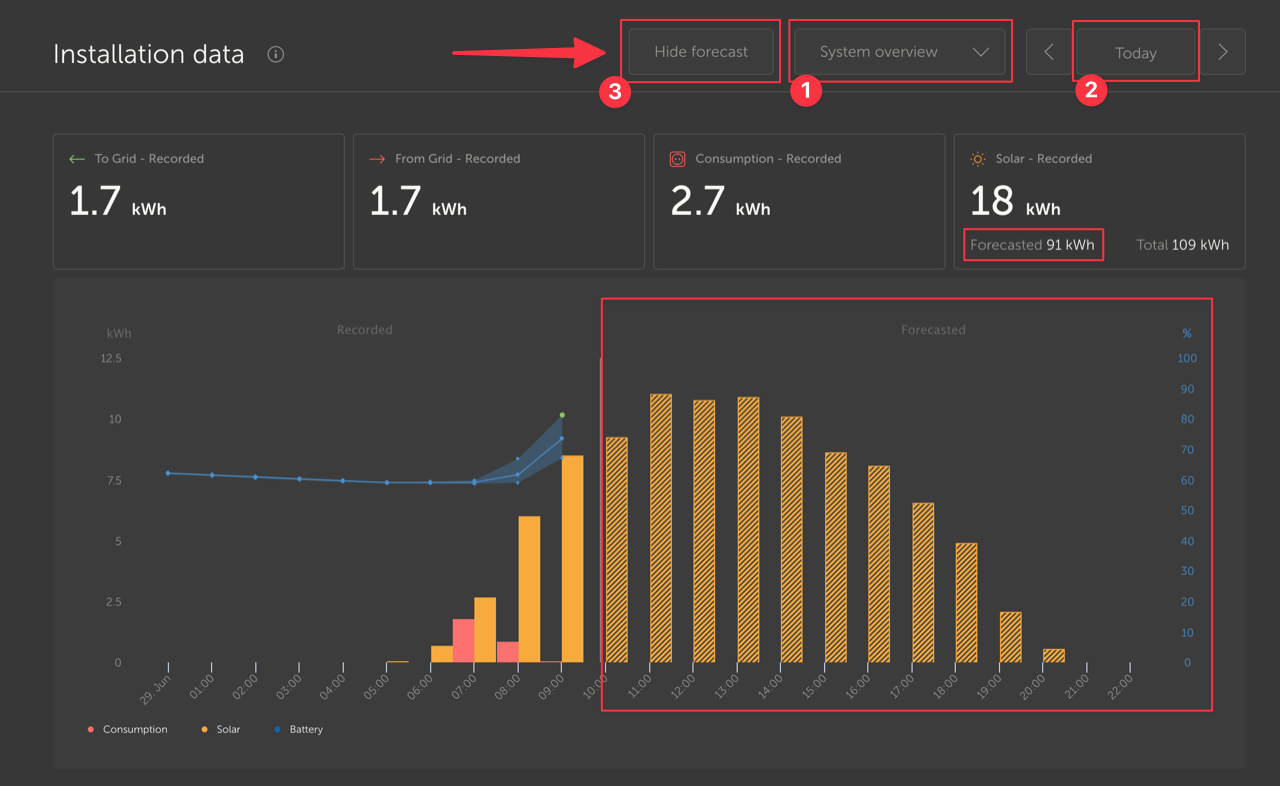 |
Clicking the Show Forecast button will expand the view to show what remains of the current day, and also draws bars to show the estimated solar production.
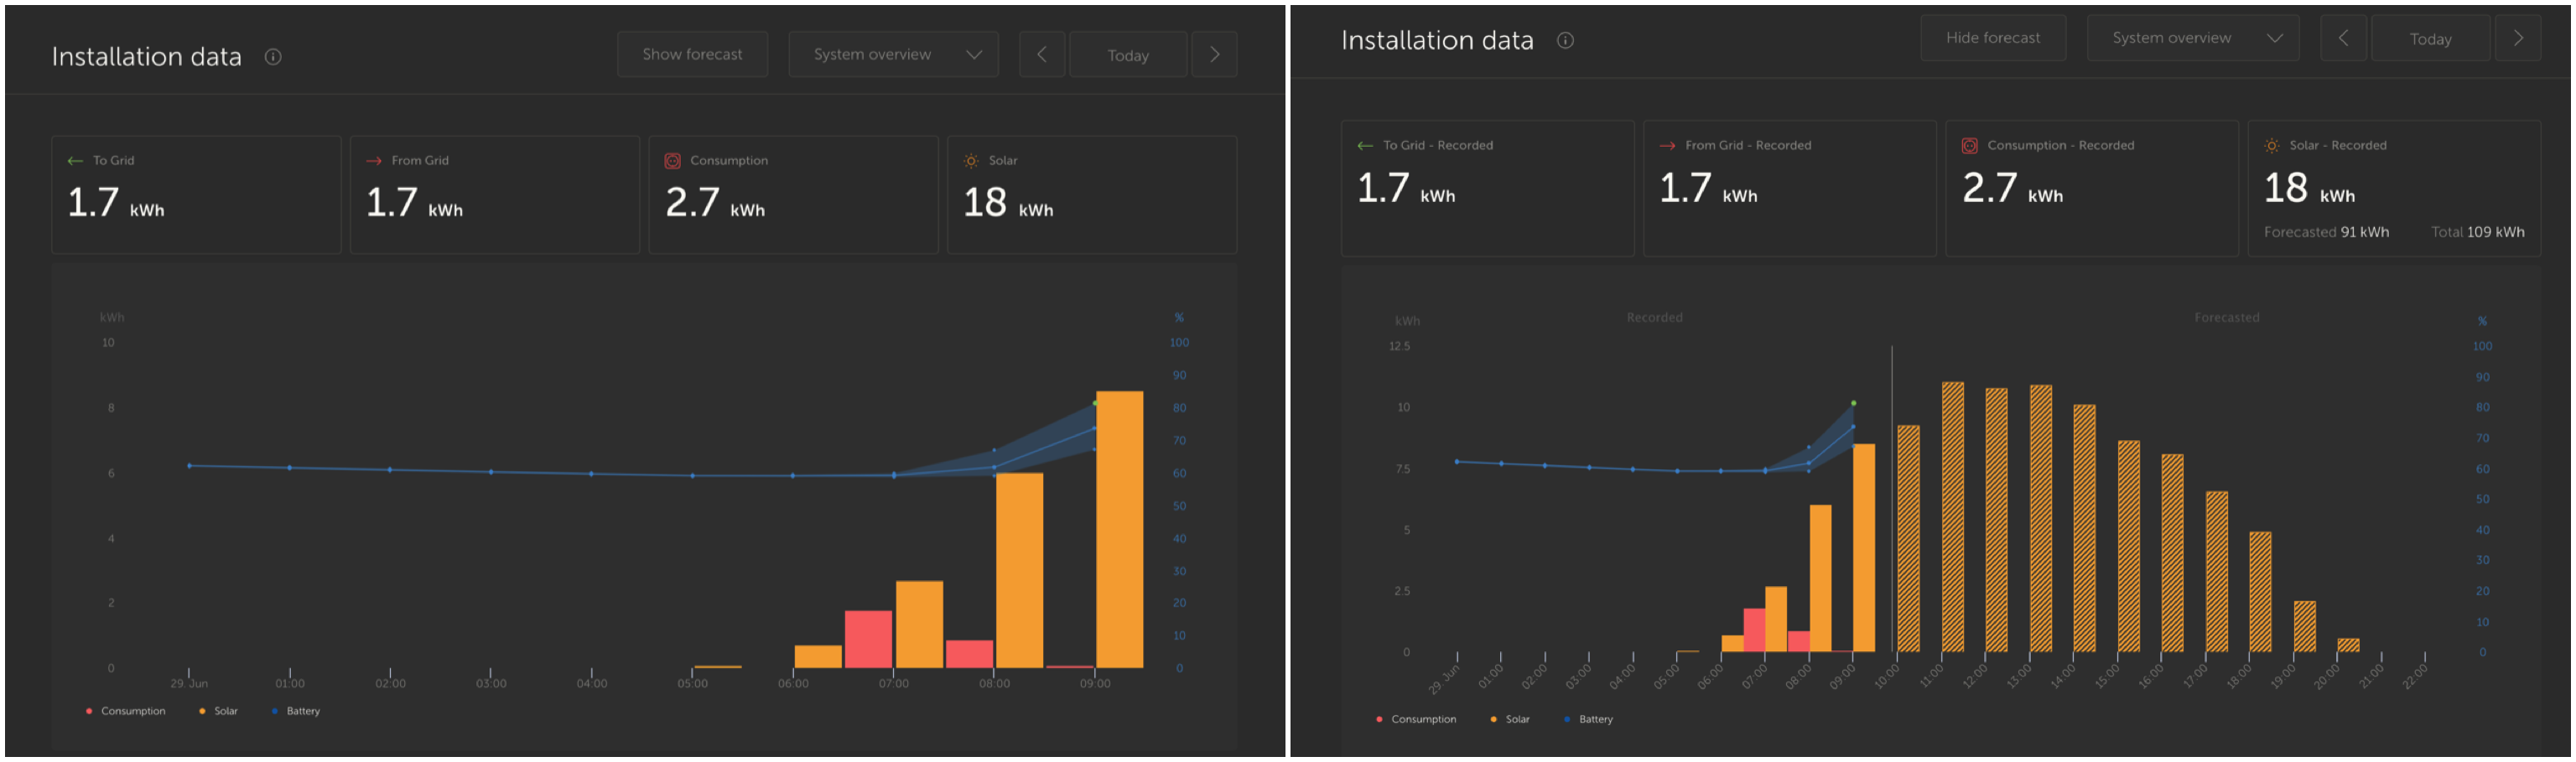 |
Showing the forecast adds more information to the Solar info box on the dashboard as well.
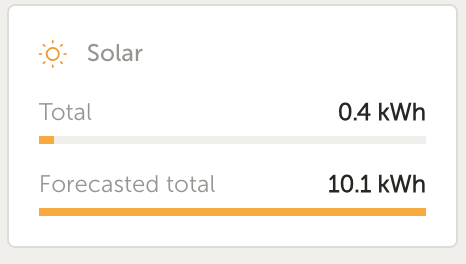 |
“Total” shows the actual solar energy that has been converted from the sun today.
“Forecasted total” is the estimate for the solar production.
There might be some rounding of these figures.
Troubleshooting
If the forecast button isn’t there, please check:
Your installation has a location set
Your site is recording hourly solar yield
You are on the ‘today’ view
For new sites that don’t yet have a solar yield history, or if you’ve only recently set the site location, please wait up to 48 hours for it be enabled and have enough information to be accurate.
This feature uses location data as a 4 km² grid, and doesn’t link any personally identifiable information or co-ordinates of your Victron site. This is accurate enough for the solar data while still maintaining your location privacy.
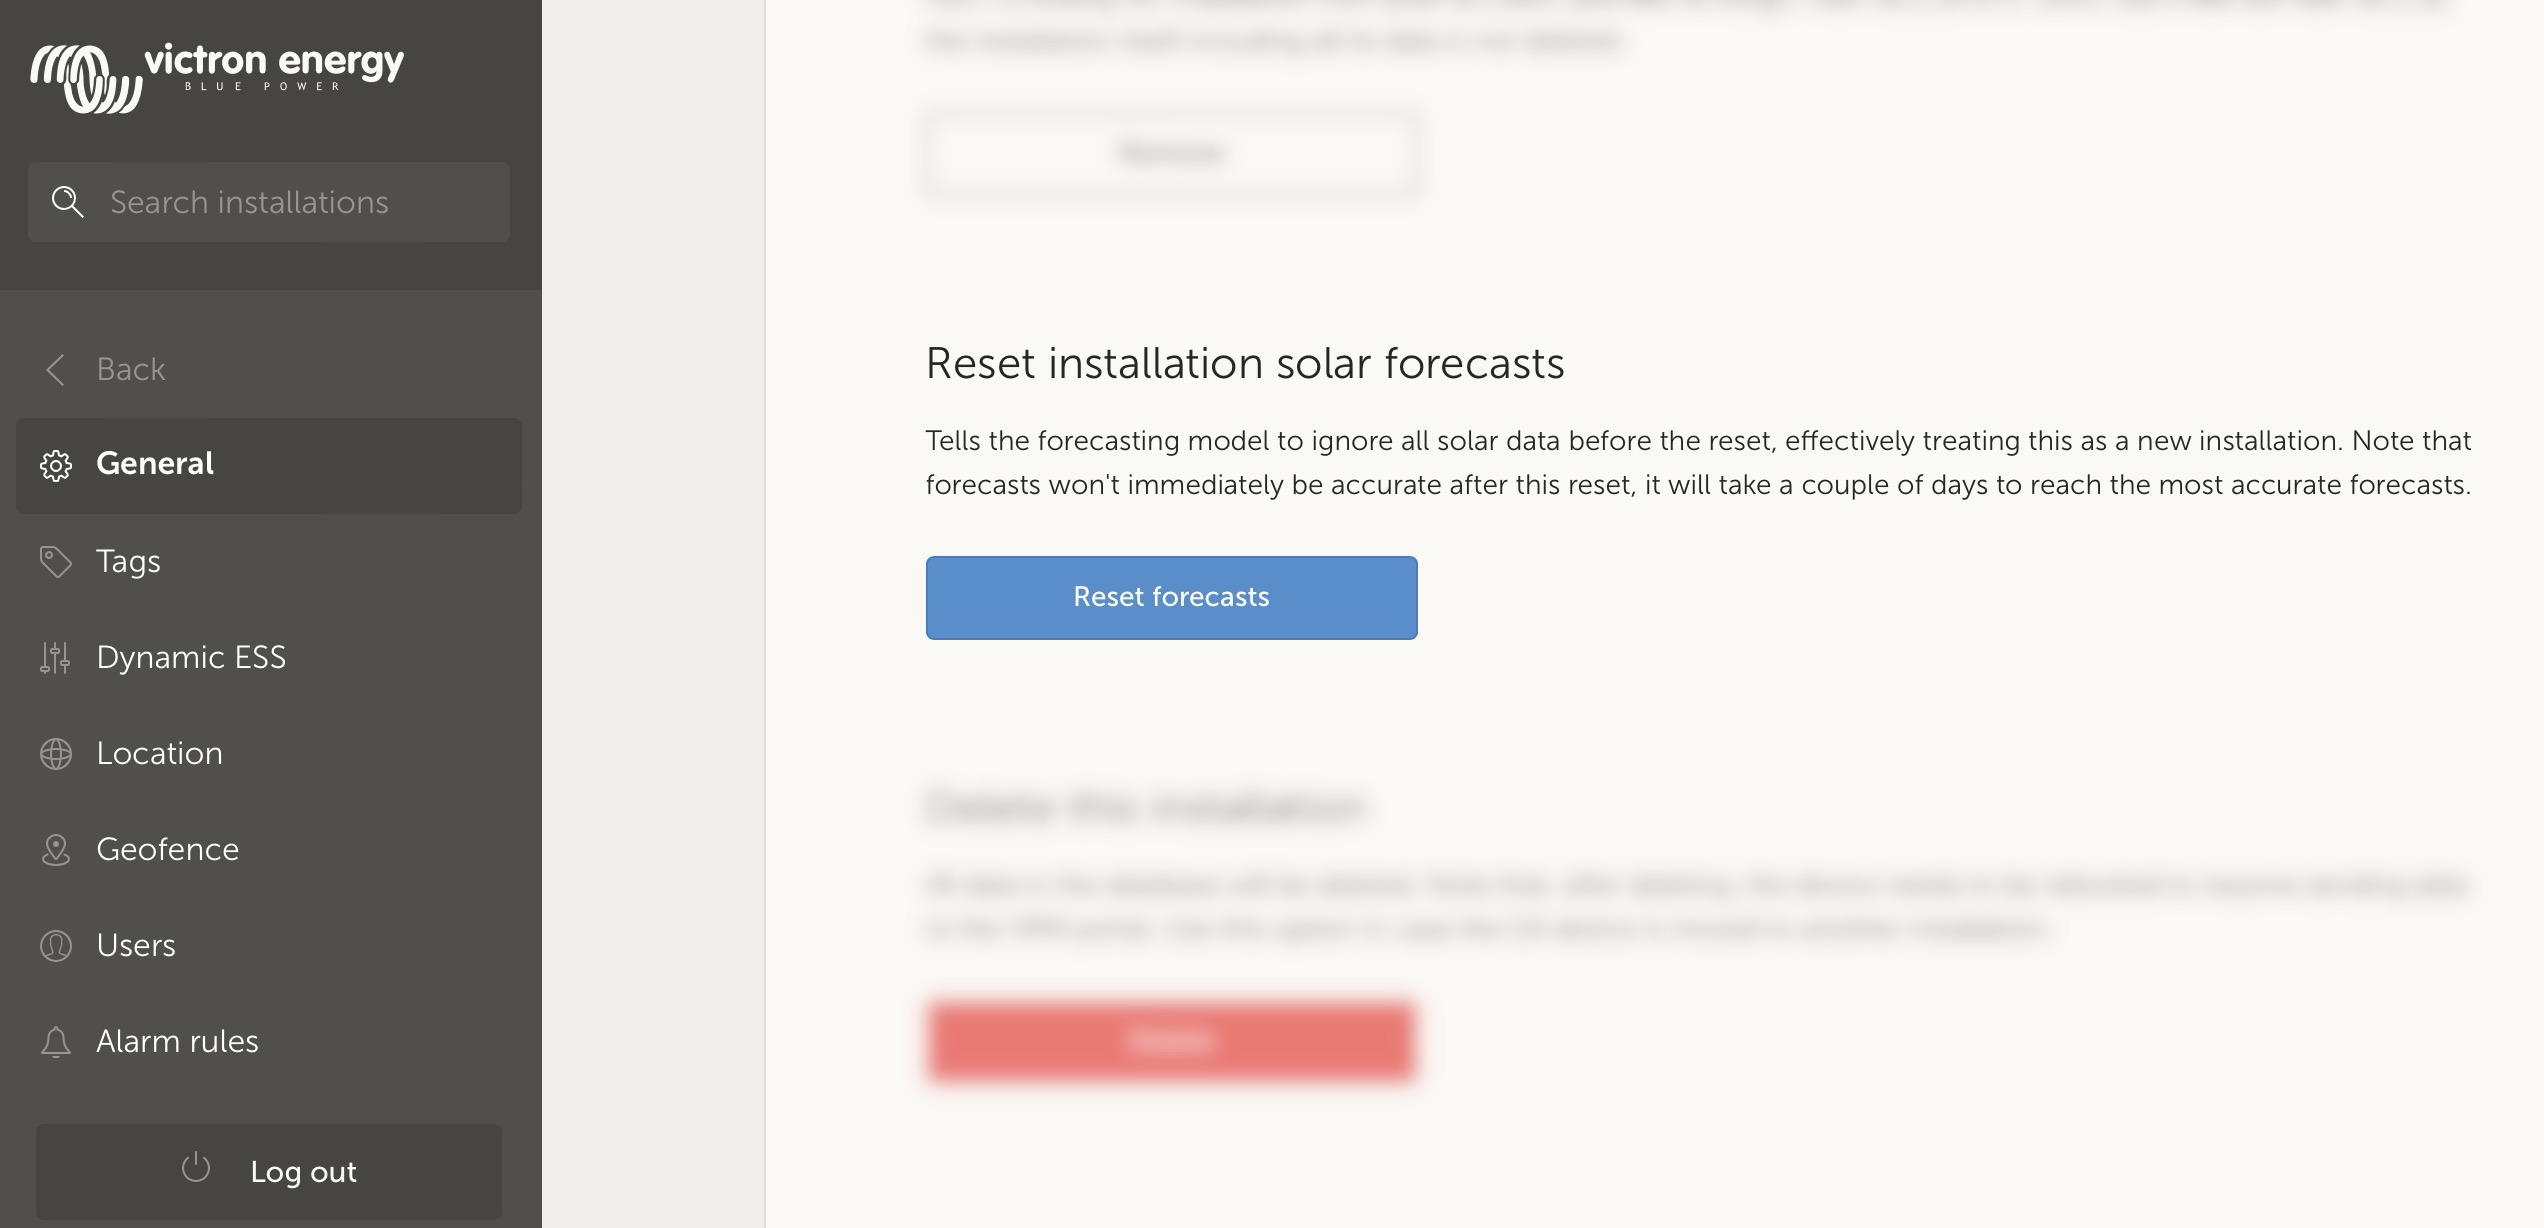
If you need to reset the solar forecast model for your site, you can do this by clicking the "Reset forecasts" button in the general system settings.
How is it done?
Solar forecast uses a machine learning model that compares historical solar production and the irradiance at the time of day and then calculates the future projected solar production based on the estimated irradiance forecast.
This automatically takes into account factors like system sizing, panel orientation & pitch, efficiency degradation, and shading without requiring any user input.
This model requires a minimum of 2 days of data, and uses a rolling 28 days of historical data to improve accuracy.
This means that over time the model will get more accurate, even as panels degrade and trees grow.
The model accounts for when MPPT trackers were at maximum production, or limiting themselves (for example when batteries are full in an off-grid system).
In addition to the dashboard estimate, we also have the underlying Solar Irradiance Forecast (W/m²) available as an advanced VRM widget.