4. Real-time data
4.1. Introduction
The dashboard can show real-time data, meaning that every two seconds data updates are sent straight from the installation to your browser - rather than pulled from the database at which the information is stored at the interval configured in Settings → VRM Portal → Interval (default 15 minutes).
The new dashboard increases the GX CPU load. Data usage is also increased. The CPU load and data usage are only increased while the dashboard is being observed.
Check the top of the page under "Last updated" to see if its in real-time mode. Here is a screenshot when using real-time data. Notice the icon for Controls on the right hand side; it only appears in real-time mode:
 |
And here is a screenshot of a system not using real-time data:
 |
4.2. Requirements
A GX Device, with Venus OS v2.60 or later
Good internet connection
Sufficient CPU resources (see GX device CPU load section)
Either the Full or Read-only VRM Portal mode access setting is enabled, which is on the GX device menu → Settings → VRM Online Portal → VRM Portal
4.3. Enable and disabling the real-time data feature
It is possible to disable the real-time data feature for each installation. Go to VRM site → Settings → General → Realtime updates green(on) / red(off).
Examples of when you want to disable real-time data are:
To keep data usage to a minimum, while keeping the other full VRM two-way communication features enabled such as being able to remotely configure and remotely update firmware.
For systems where CPU load is already at the edge of what is possible, so rather than each time waiting for it to be automatically disabled (see below), and thus also having a short time of high CPU load on the system, disable it pre-emptively.
4.4. GX device CPU load
Transmitting the data to the VRM Dashboard causes an extra load on the CPU in the GX device. As such, systems already operating at 100% CPU, or close to it, would be overloaded with the result that tasks are left waiting, slow response on Remote Console, slow data updates, and eventually also reboots of the GX device.
To prevent this, the dashboard will automatically suspend itself in case the CPU load is too high, in which case a warning is shown on the lower right on your screen:
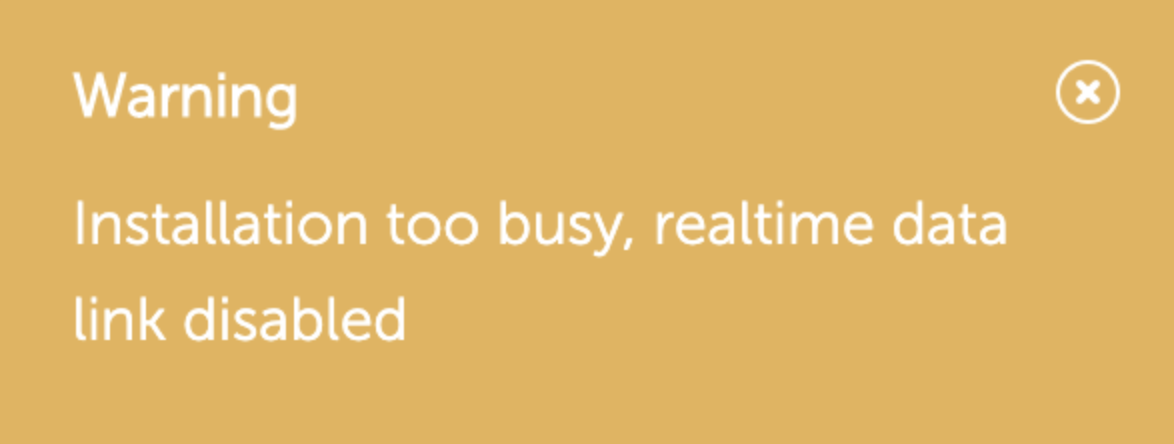 |