A mobile environmental observatory has been established in Greenland which provides almost realtime data from a number of wifi-connected sensors located on the Arctic continent.
Simultaneous real-time data is collected from Air, Ice, Ground, Rivers and the Marine environment and transmitted to climate scientists working at the Arctic Research Centre at Aarhus University in Denmark.
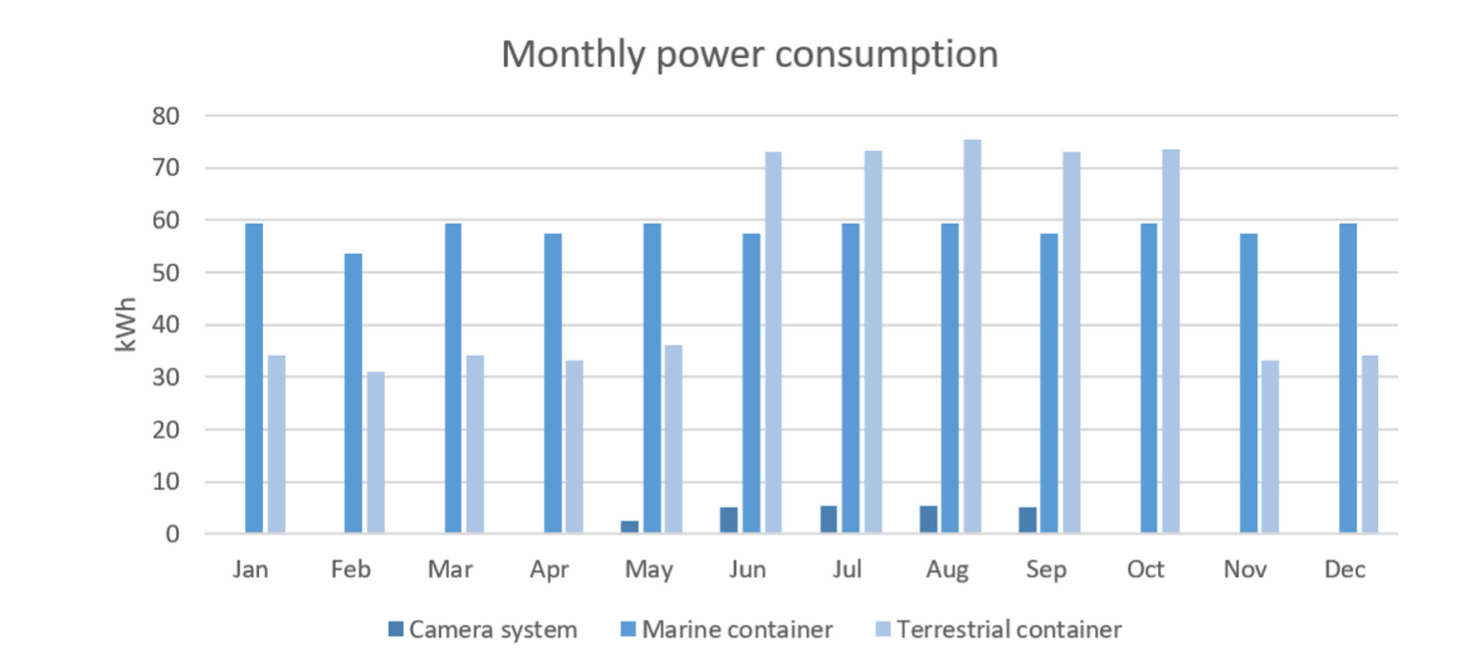
Many challenges have been overcome to make data available continually, not least the need to generate energy during the Arctic Winter in order to provide instruments with reliable power from batteries which operate at very low temperatures.
It is hoped that the project’s success will provide a model for global remote environmental data collection, and satellite transmission.
Remote Mobile Observatory
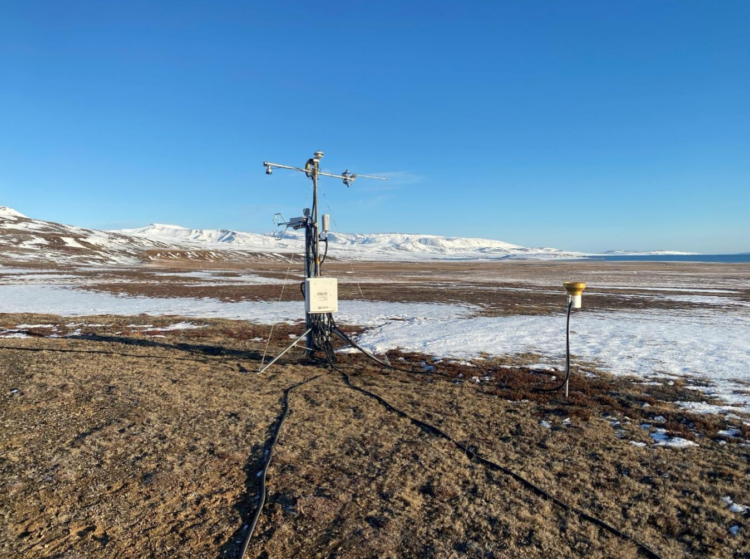
ARC-MO the Arctic Research Centre Mobile Observatory is a project to establish two remotely operable containerised weather stations in Greenland. The 2 metre-long wind and solar powered insulated containers are equipped to measure a number of temperature, humidity, chemical, radiation, and biology related data, continuously. The recorded data is averaged and transmitted daily – principally to the Arctic research team at Aarhus University. Data from this station is made available to interested parties at Gios.org
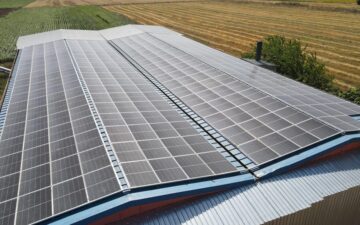
Two solar panels on the roof, and two more on the south-facing wall of each container provide plenty of power in the summer. The 380W dual string panels have been chosen for their resistance to the ‘shadow effect’ as snowdrifts frequently obscure part of their surface. In practice the vertical panels can still provide 50% of their rated output when obscured by an 85 – 90cm snowdrift …whereas conventional panels would not harvest energy when covered to a depth of 20cm.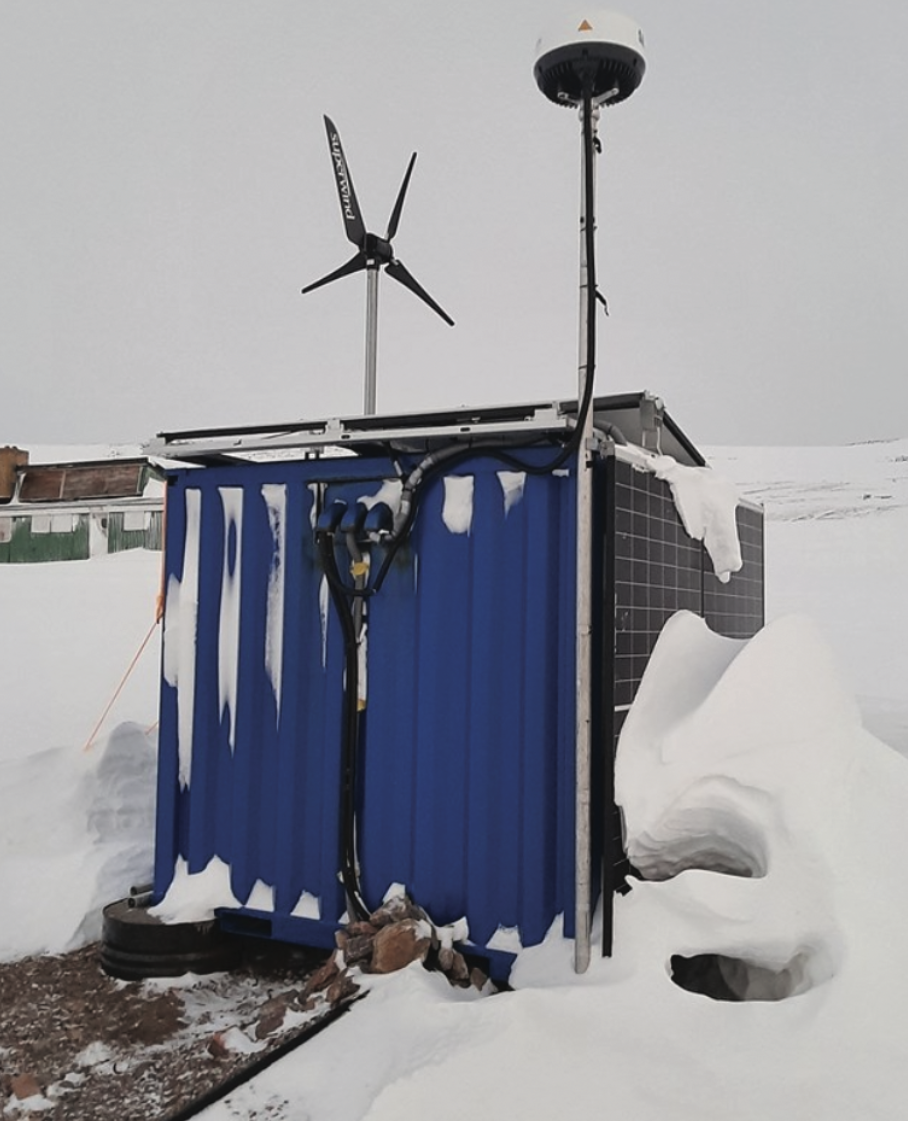
All year round Power
During the sunless Arctic winter when the solar output falls to zero, power is provided by a Superwind 353 wind turbine. The cut-in wind speed for these units is 3.5m/sec which would be felt as a gentle breeze (Beaufort F3) …there is no upper wind speed limit. At 12.5m/s (Beaufort F6) the power output from the 24V turbines is 350W. When the batteries have reached full charge the insulated containers will be warmed by the fins of the turbine regulator heat-sink. Currently each container has one turbine, but two are planned.
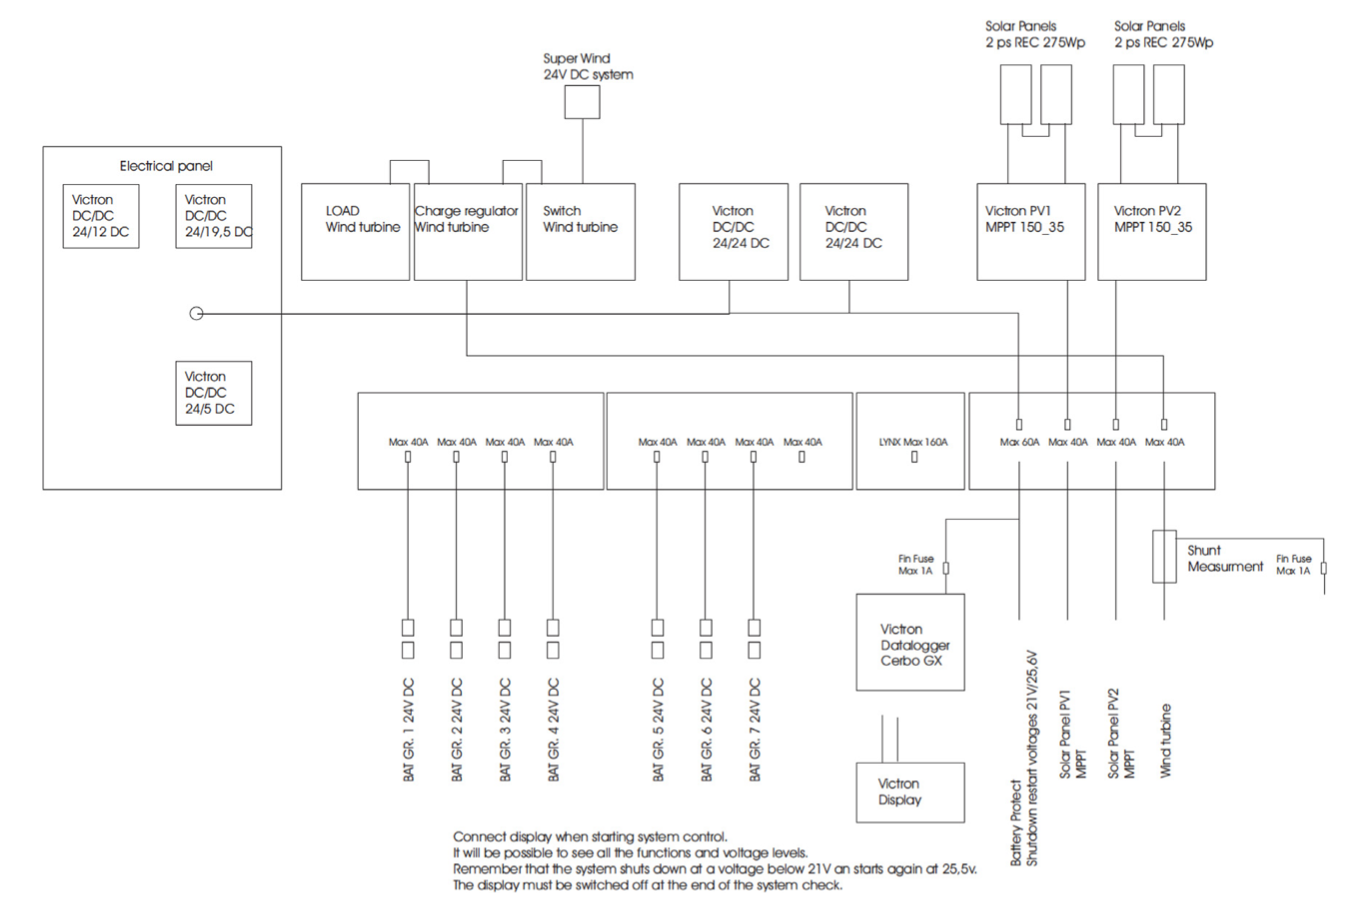
The power installation was designed built and supplied by Danish companies: MG Solar; Solar Polaris and Scanpotec and comprises the following equipment and topography:
- 2x SmartSolar MPPT 150/35
- Cerbo GX
- GX Touch 50
- SmartShunt 500A/50mV
- Lynx Shunt VE.Can
- Lynx Distributor
- BatteryProtect 12/24V-65A
- 32 x Hoppecke Grid Xtreme VR 12-165FT
- 4 x REC Alpha REC370AA – 370 Wp
- 2 x Superwind SW 353 w/charge regulator
The 63kWh battery storage is caged and was transferred from a Danish Navy vessel – which delivered the equipment to site – by helicopter to the location for the weather station.
Staying in control from far away
Because the location is not practically accessible for many months of the year, it is imperative that the batteries are protected from over-depletion by a device known as a BatteryProtect – which will drop loads if the batteries ever fall below 40% state of charge (SoC), thus avoiding battery damage or even failure. Service will resume when a charging current is again received and the batteries climb over a pre-determined SoC threshold.
The Cerbo GX harmonises the system charge/discharge cycles and reports power data to the free-to-use online platform VRM from where system data can be viewed and the programming can be changed, if required, from anywhere in the world.
Battery energy is provided to a comprehensive deployment of scientific instruments measuring climate data including temperature, wind speed, humidity and radiation; gas analysers, ultra sound, radio, thermal and light measuring equipment readings – the data from all of which are recorded by data loggers. Photographic equipment records the arrival and growth of insect and plant life in the summer months.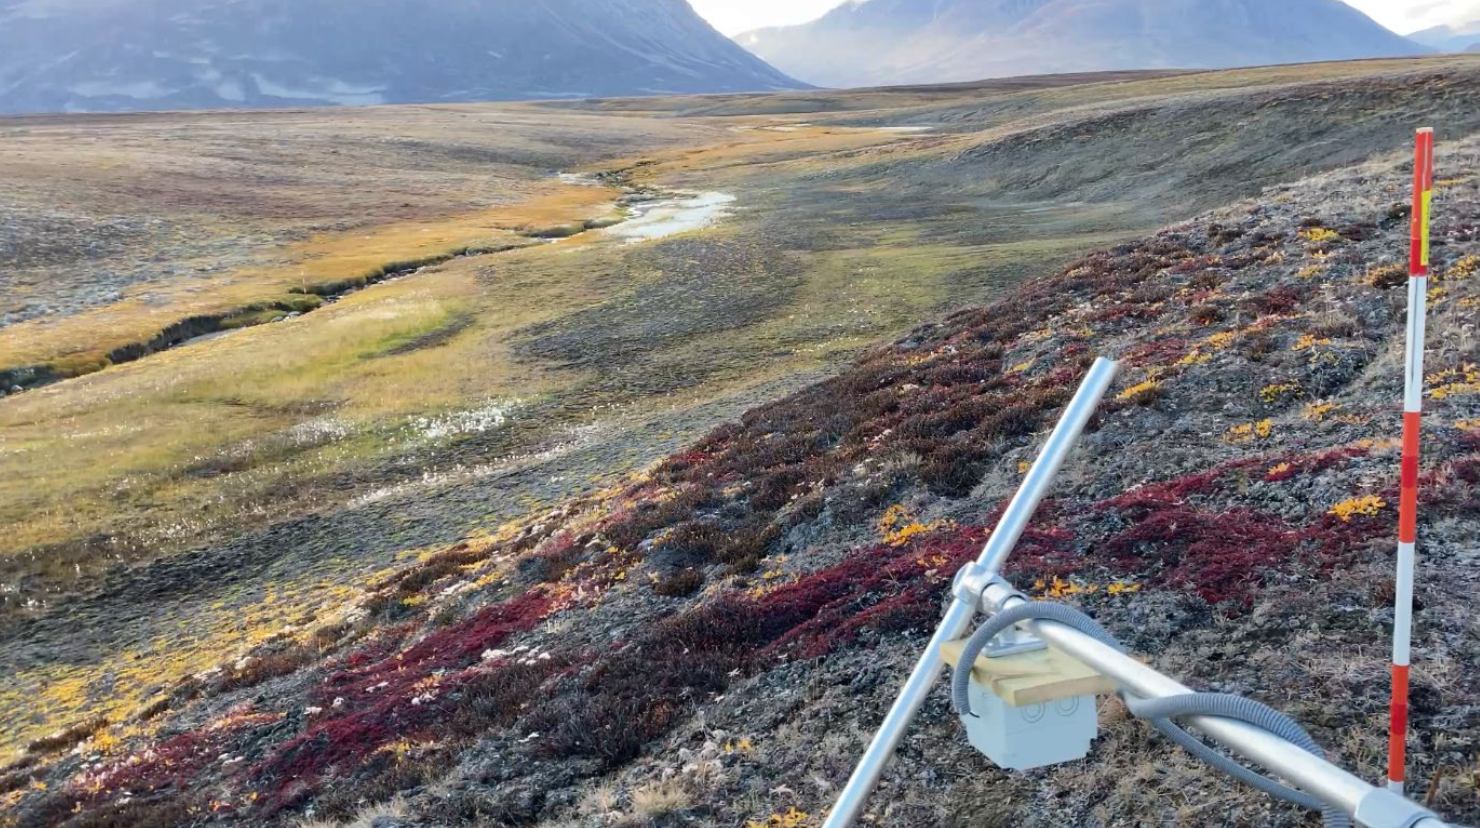
Data Storage
An extensive article has been made publicly available concerning every aspect of this far sighted project. It was written by Søren Rysgaard et al – whom we quote:
The atmospheric and terrestrial data from the ARC-MO units are collected directly on a CR6 datalogger equipped with 16 GB industrial grade microSD memory card. The ocean data is stored on the topside unit. Daily, all data are synchronized with a local computer (Lenovo T 550) located inside the container HF data are collected via ftp protocol directly from logger memory card and LF data are synchronized with the use of LoggerNet software with a built-in schedule collection feature. All data are saved and stored on the internal HDD of the Lenovo T550 computer. The local computer initiates Iridium connection on daily basis and transmits a single LF data file to data server.
A Lenovo T 550 computer is used for data handling, FTP and application server in both containers (Marine, Terrestrial). This model has standard operating specifications suitable for work in extreme environments (low temperature, high humidity, low power consumption). It is also designed to restart after a power failure. Both average data and high frequency data from the data loggers and camera system is stored on a 2 Tb SSD hard disk.
In both containers, the server runs a scheduled job for transmitting data by the Iridium satellite system (Iridium Sailor 4300). The job turns on a relay to power up the Iridium modem, compress data files, waits until an internet connection is established, then transmits data by FTP. The connection is then closed, and the modem powered off. The data files are currently transmitted to a FTP server at Aarhus University. If the connection is not established and/or data files are not transmitted successfully, the computer will try to send the data files later. It is also an option to access the station by an external FTP connection and download data or upload new applications or setup files (via static IP address and using port forwarding). Only averaged result files and status files are sent, currently below 100 Kb each day. The max transfer speed is 172 Kb/s. Raw files (high frequency data etc.) and pictures from the camera system are saved on the hard disk (and on the Campbell data loggers as long as space is available). To keep telemetry costs acceptable, these files need to be collected when visiting the station.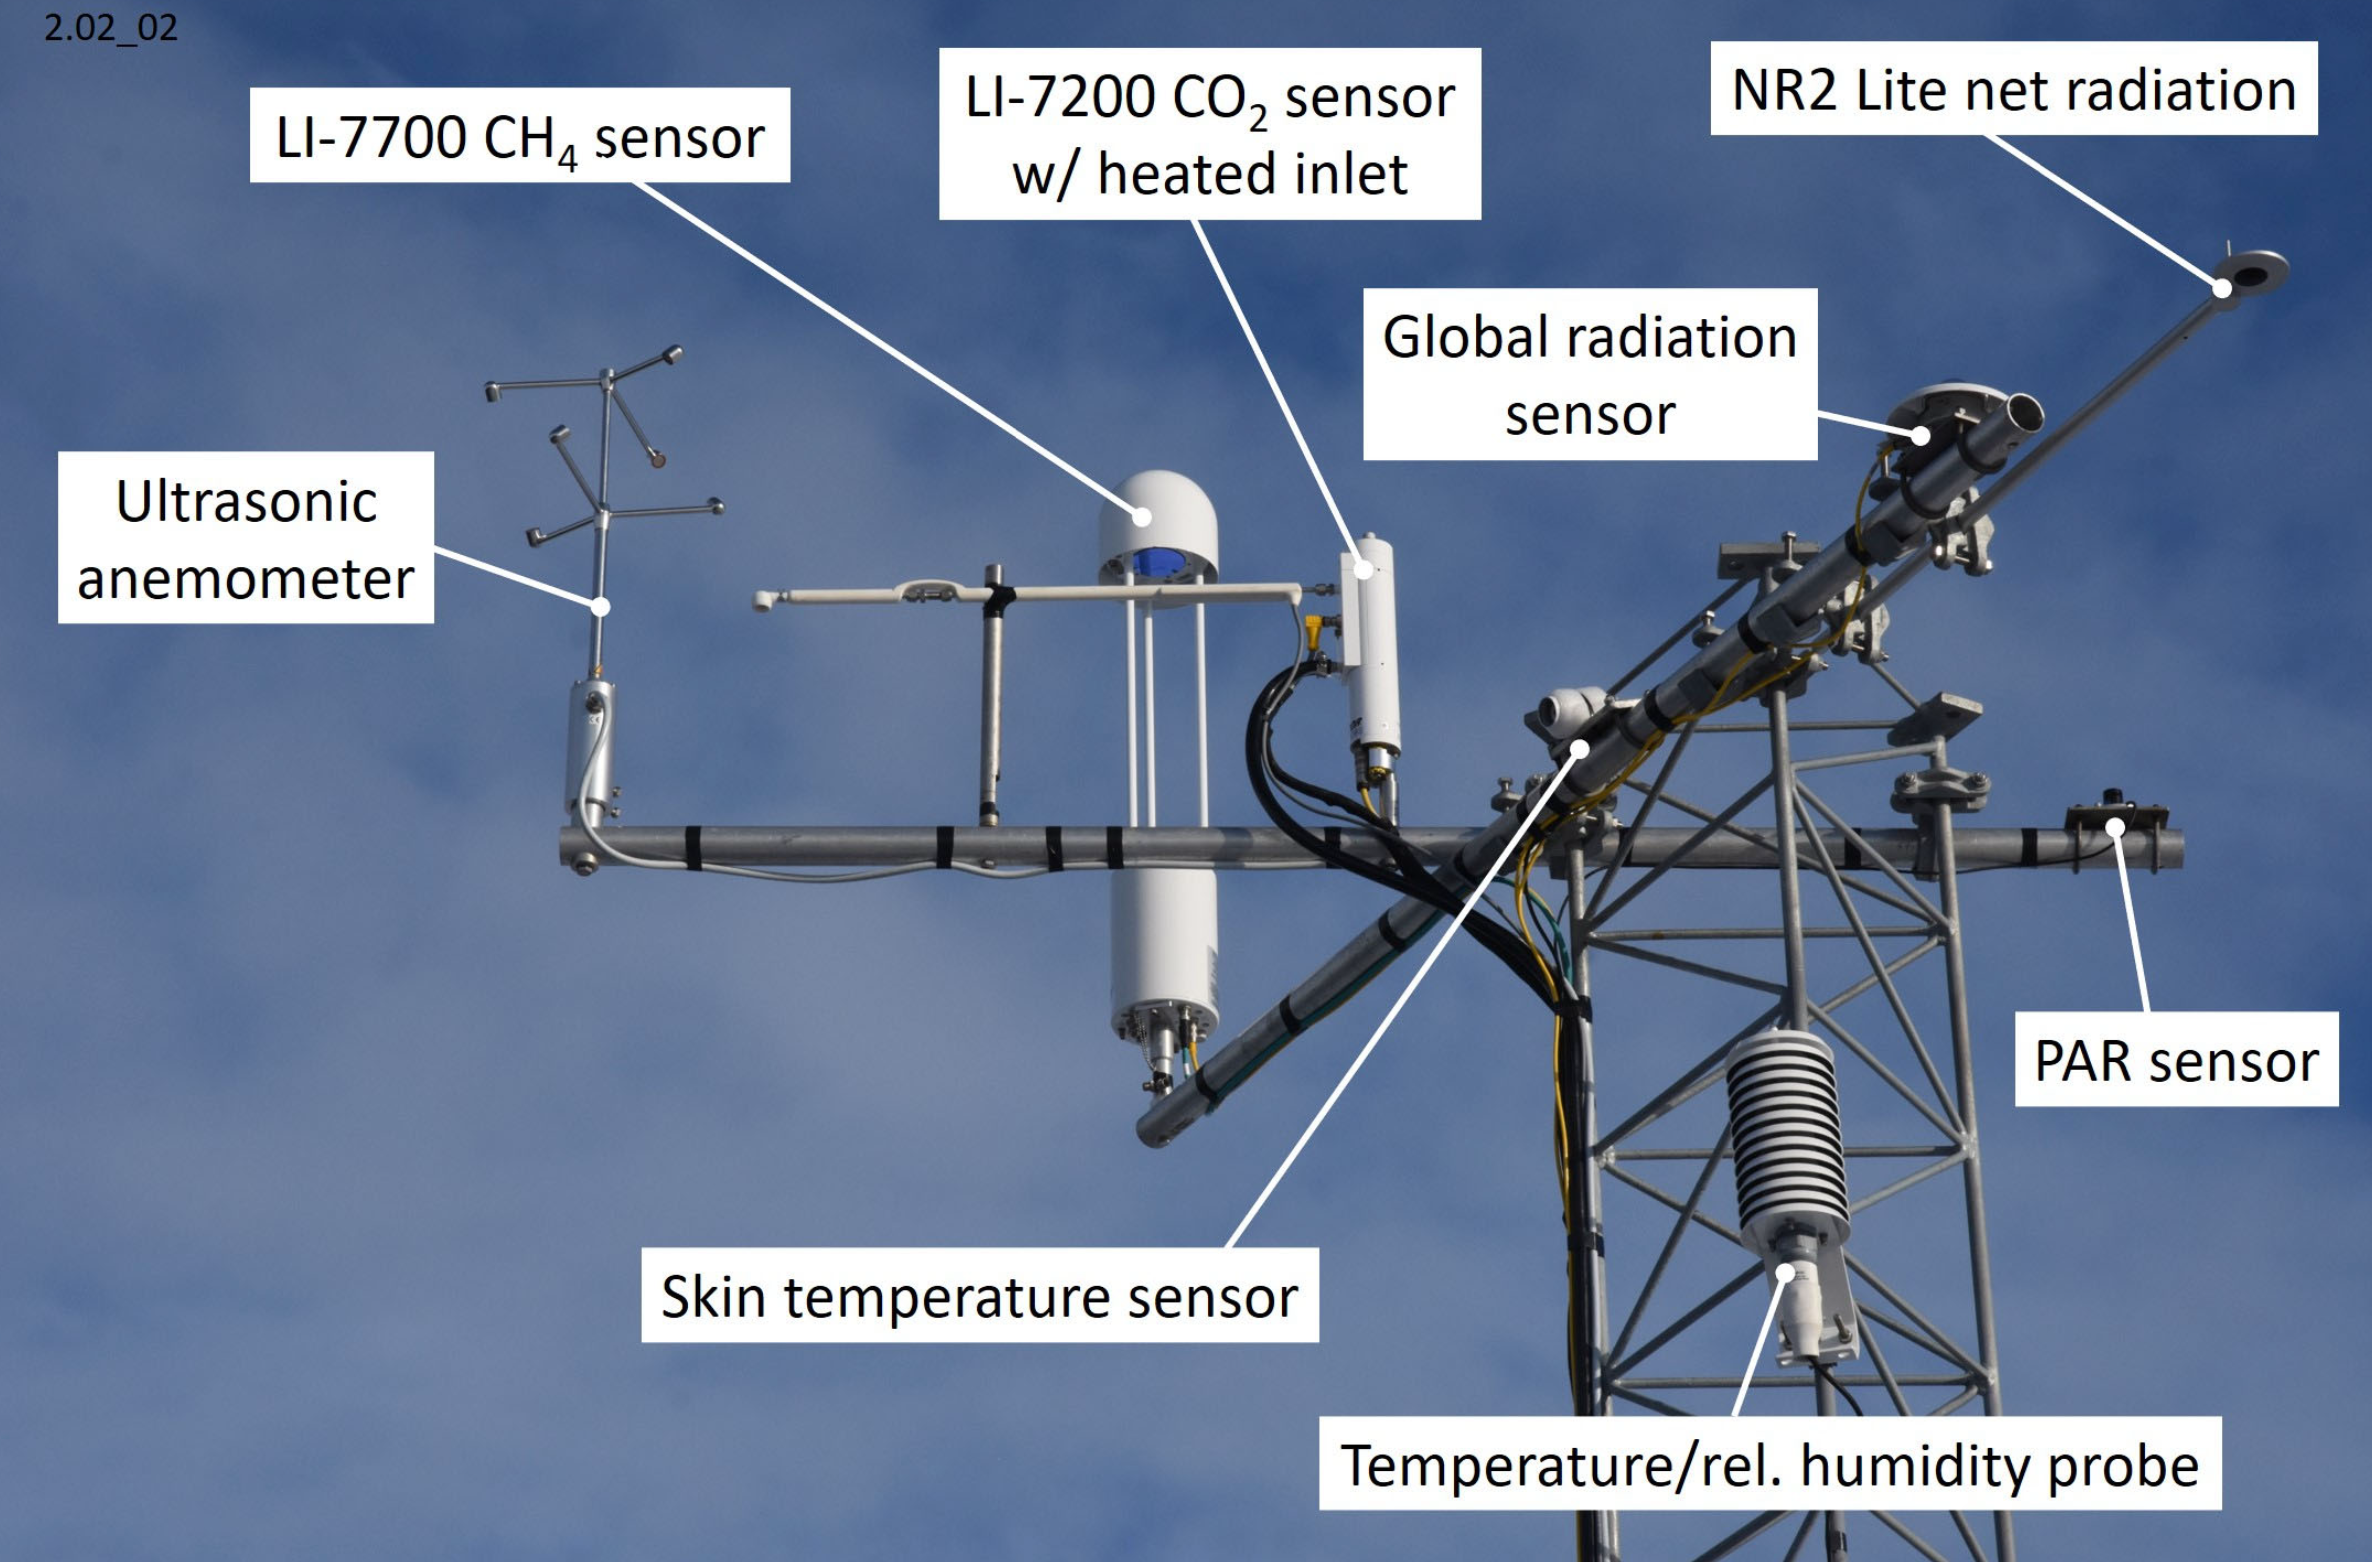
Wifi Connection
Between the two containers, Ubiquiti Rockets (Prism 5AC 5 GHz) and Ubiquiti airMax disk antennas establish a data link via a long range Wi-Fi connection. The distance between the two containers is 25 km. Moreover, it is possible to transmit data within the stations. More specifically, between the terrestrial container (Zackenberg) and the camera system and the limnic sites. There, a TP Link CPE 210 establishes the Wi-Fi connection. We selected a 2.4 GHz system, because theRaspberry Pi computers also connect by Wi-Fi, and do not support 5 GHz. The camera system is only running in the summer-time (from May 1. to August 31.). For the rest of the year, the Wi-Fi system is turned off.
Data Access
The data stored on the FTP server is automatically transferred via a downloading script running on a local server to a local PostgreSQL database. There, a processing script generates derived values from the measurements to calculate parameters such as sea ice thickness and status of the system and system components. The database is then linked with a Grafana dashboard to visualize selected measurements, derived values, and health parameters from the system. Each link of this chain is deployed locally on the server via a Docker container, which allows the installation to be reproducible and scalable. The coding is done in the Python programming environment, which makes it easy to read and reusable by a large community of users.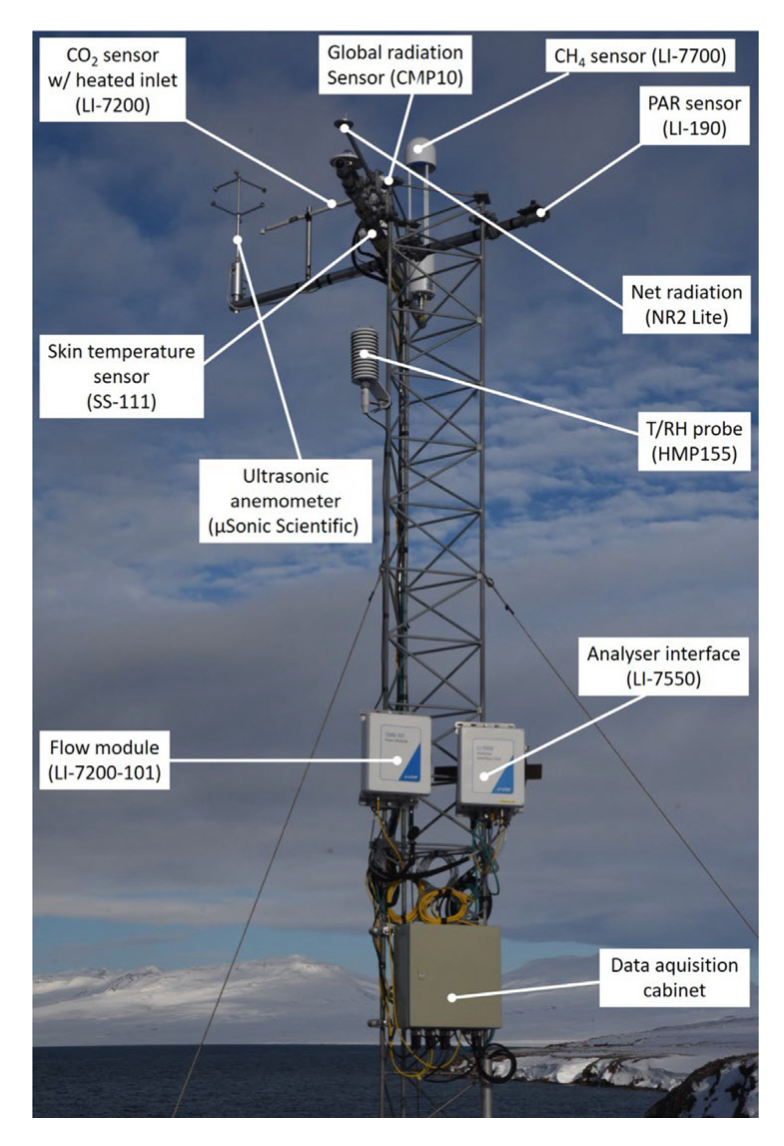
The Grafana dashboard allows to dynamically change the time range of visualization and to have an overview of all the available data. We use a combination of standard plotting tools and custom plugins (plotly, Grafana Labs) in the Grafana dashboard to display both time series data and profile data of the acoustic doppler current profiler (ADCP). Visual links between different data plots can be made through a duplicated cursor shown on all the graphs. Furthermore, Grafana allows to generate alerts based on the received data, which allows users to be notified by changing status of the system or by environmental changes detected by the sensors.
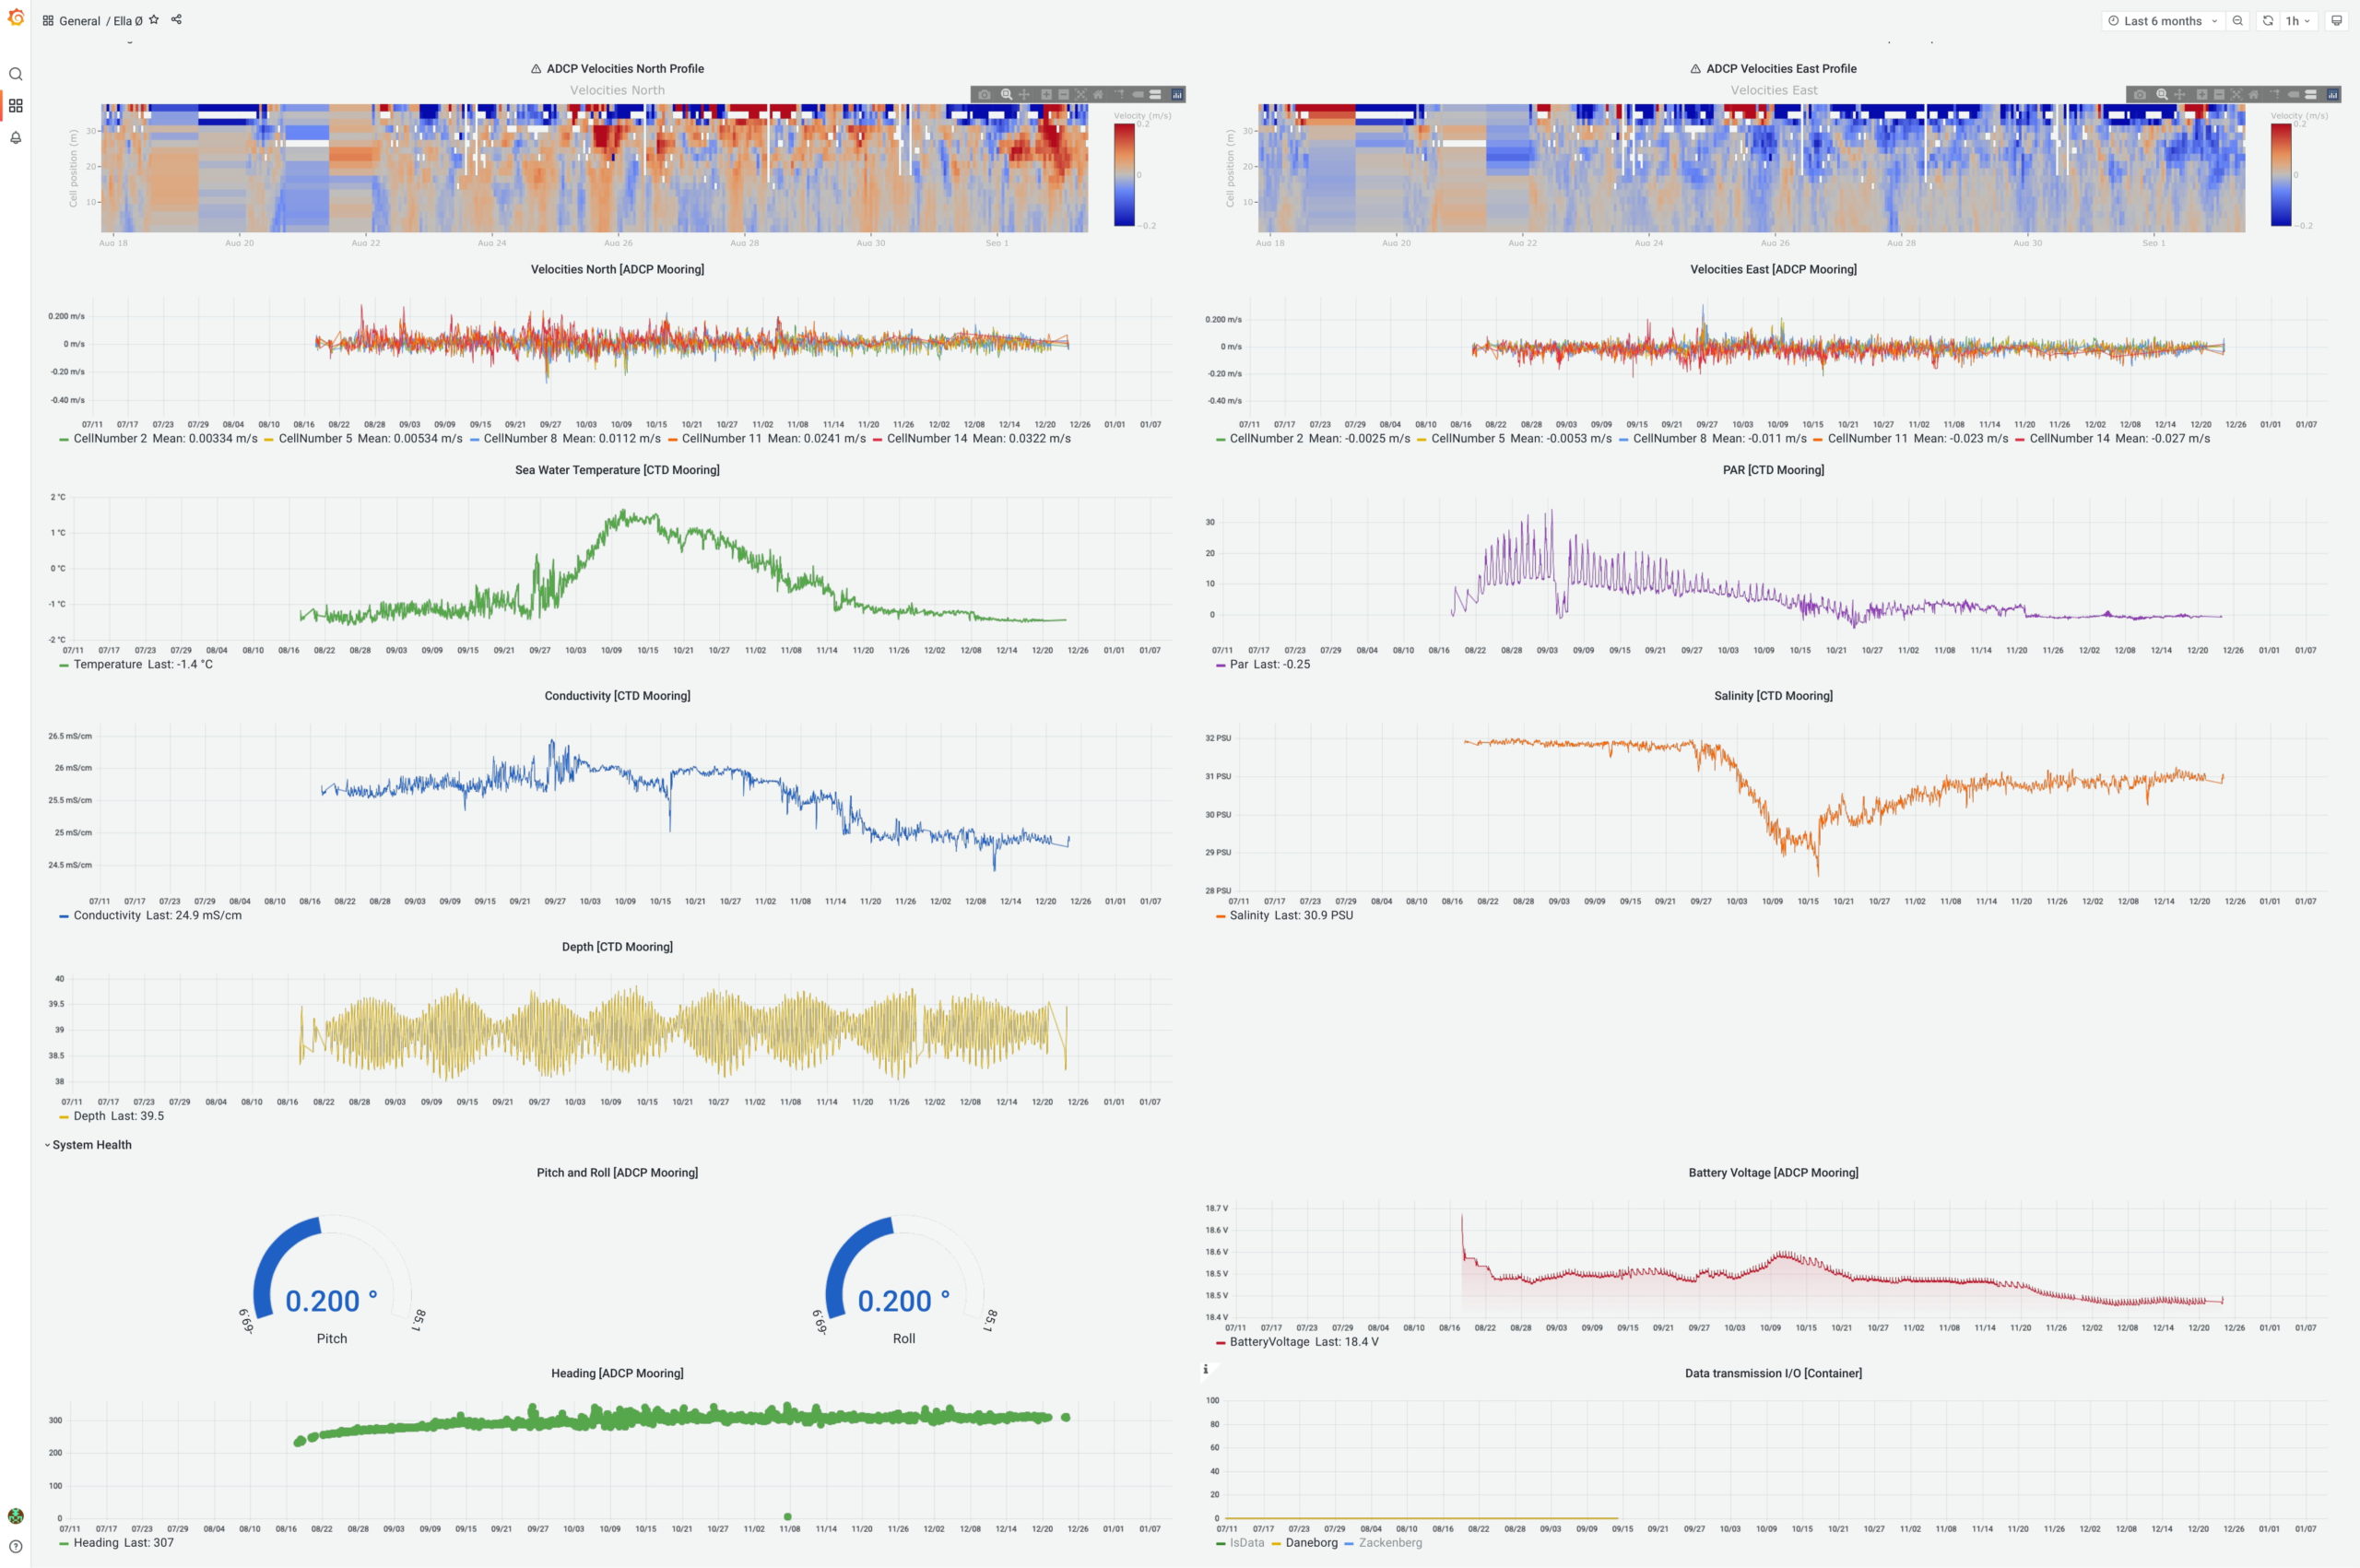
All displayed data (raw, filtered and derived data) can be downloaded directly through the application in csv format. This comprises both the raw data generated by the sensors, the filtered data and the derived data. Data tiles can be shared via links, snapshots and embedded via an automatically generated html code.
The data is available on our Greenland Integrated Observing System (GIOS) homepage https://gios.org.
You can read full-length academic article from Aarhus University’s climate research team here.


