We are excited to announce the launch of a new feature for VRM – Solar Forecasts.
This feature combines a model of your sites solar production potential with irradiance forecasting data from Solcasts global fleet of weather satellites.
The Solcast network provides 600 million new irradiance forecasts every hour.
Getting started
Existing installations with a solar history and location set can get started right now.
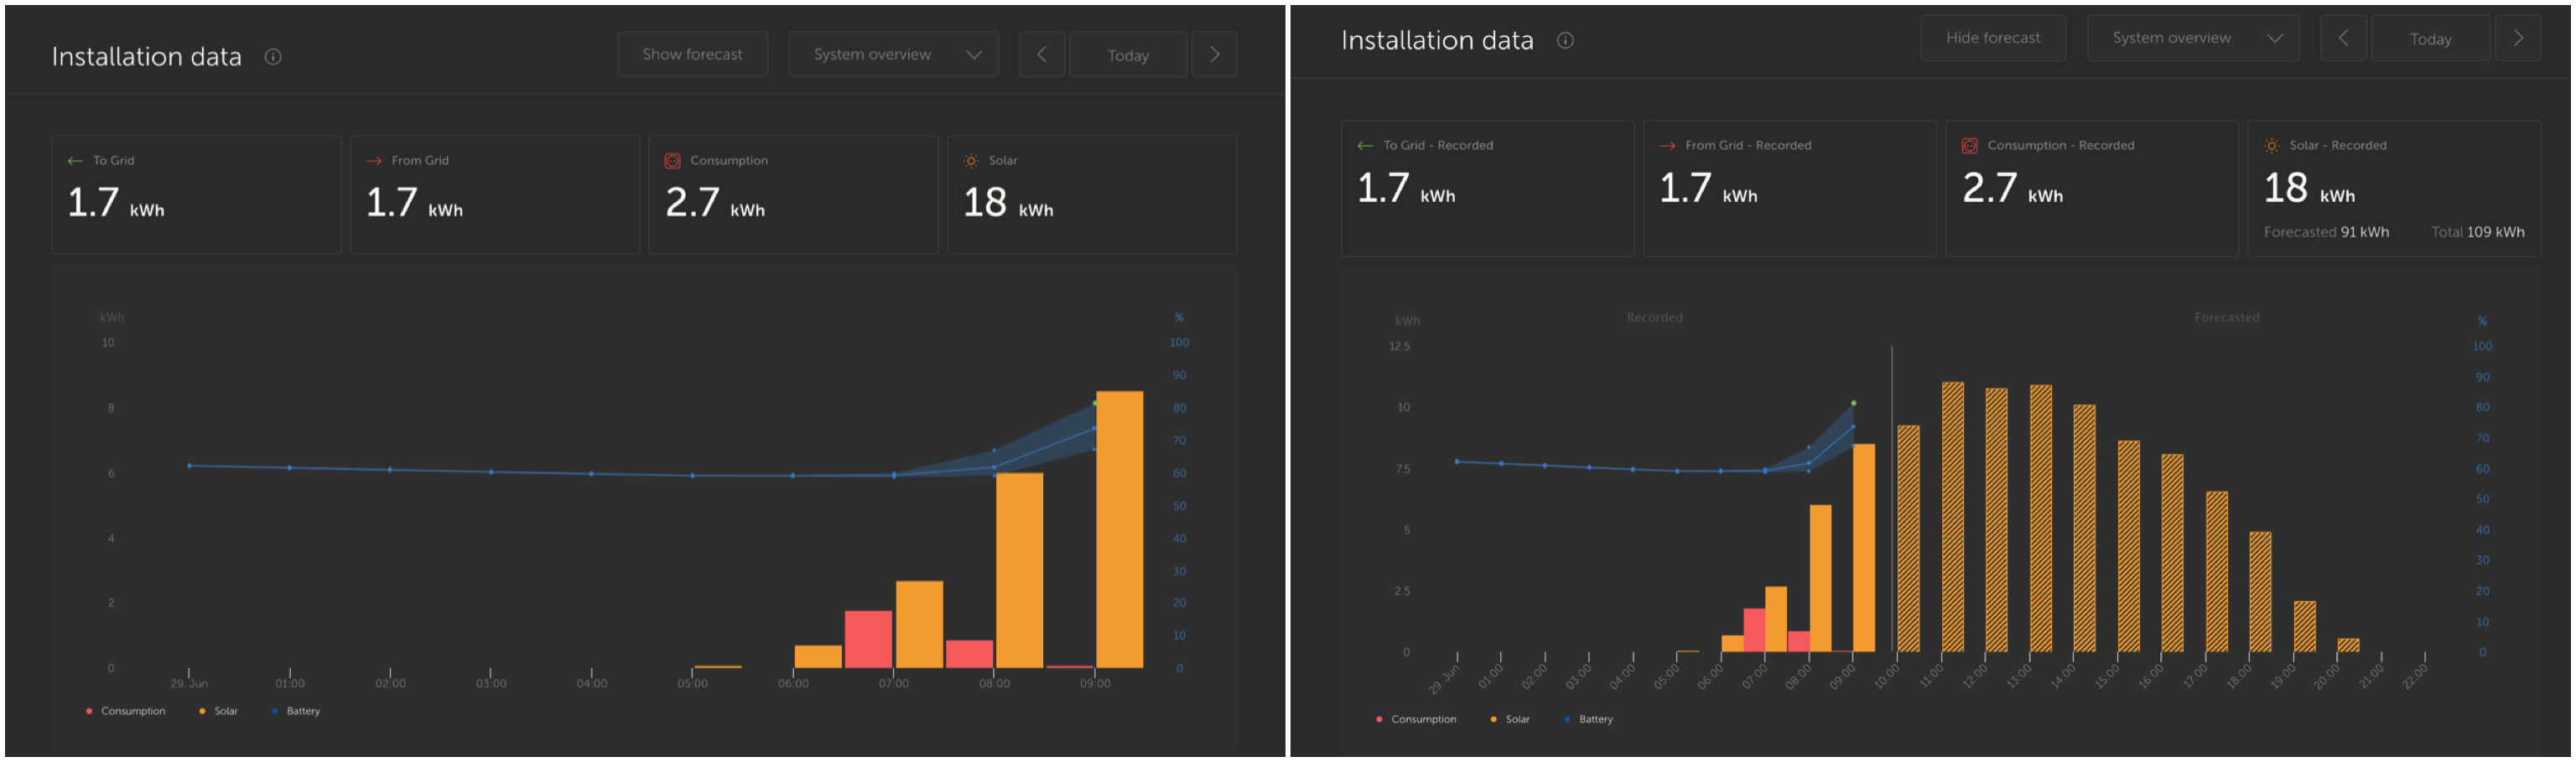
To see the solar forecast, open your site VRM dashboard and select ‘Today’. This should reveal a Show/Hide forecast button.
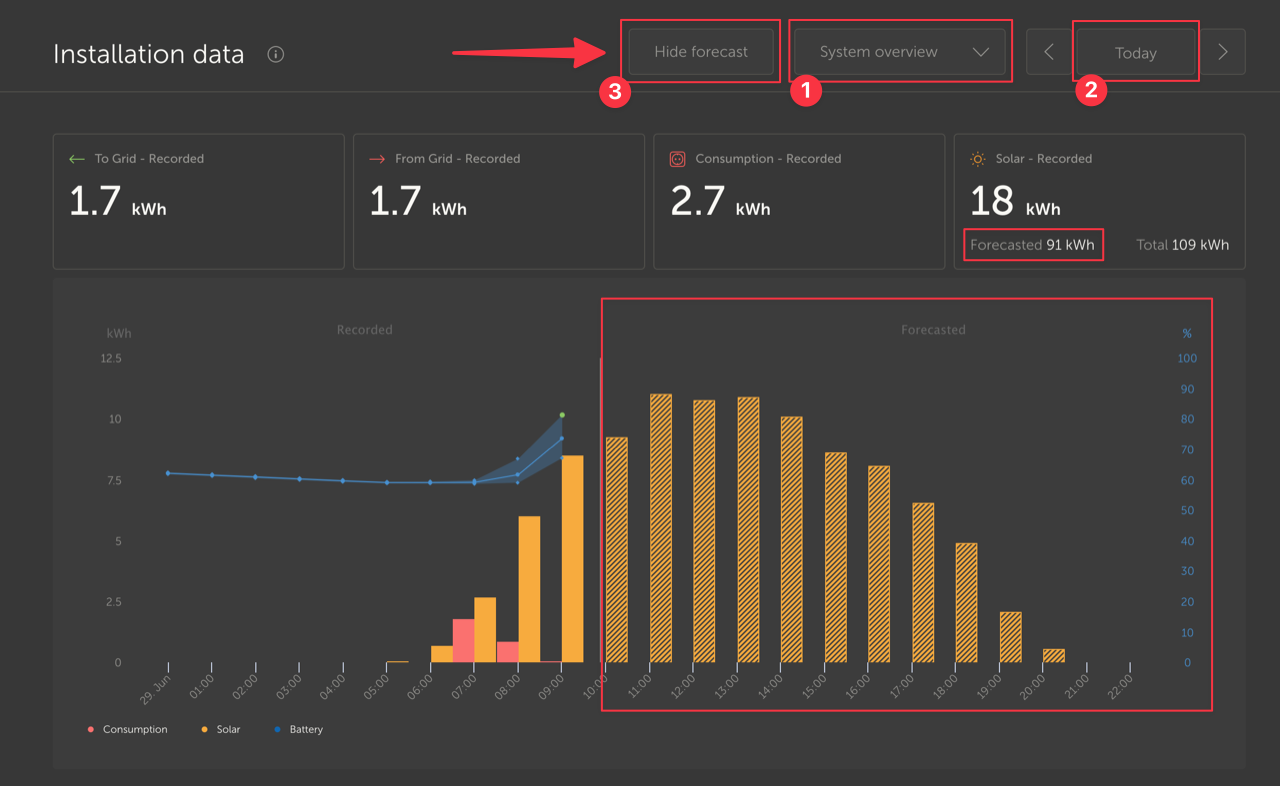
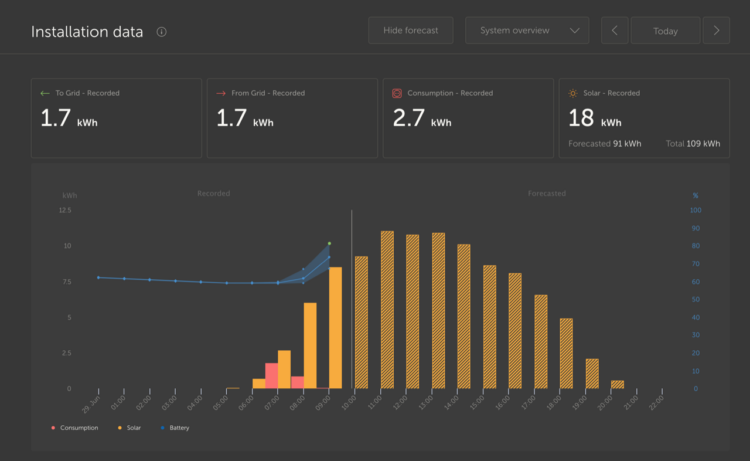
Clicking the Show Forecast button will expand the view to show what remains of the current day, and also draws bars to show the estimated solar production.
If the forecast button isn’t there, please check:
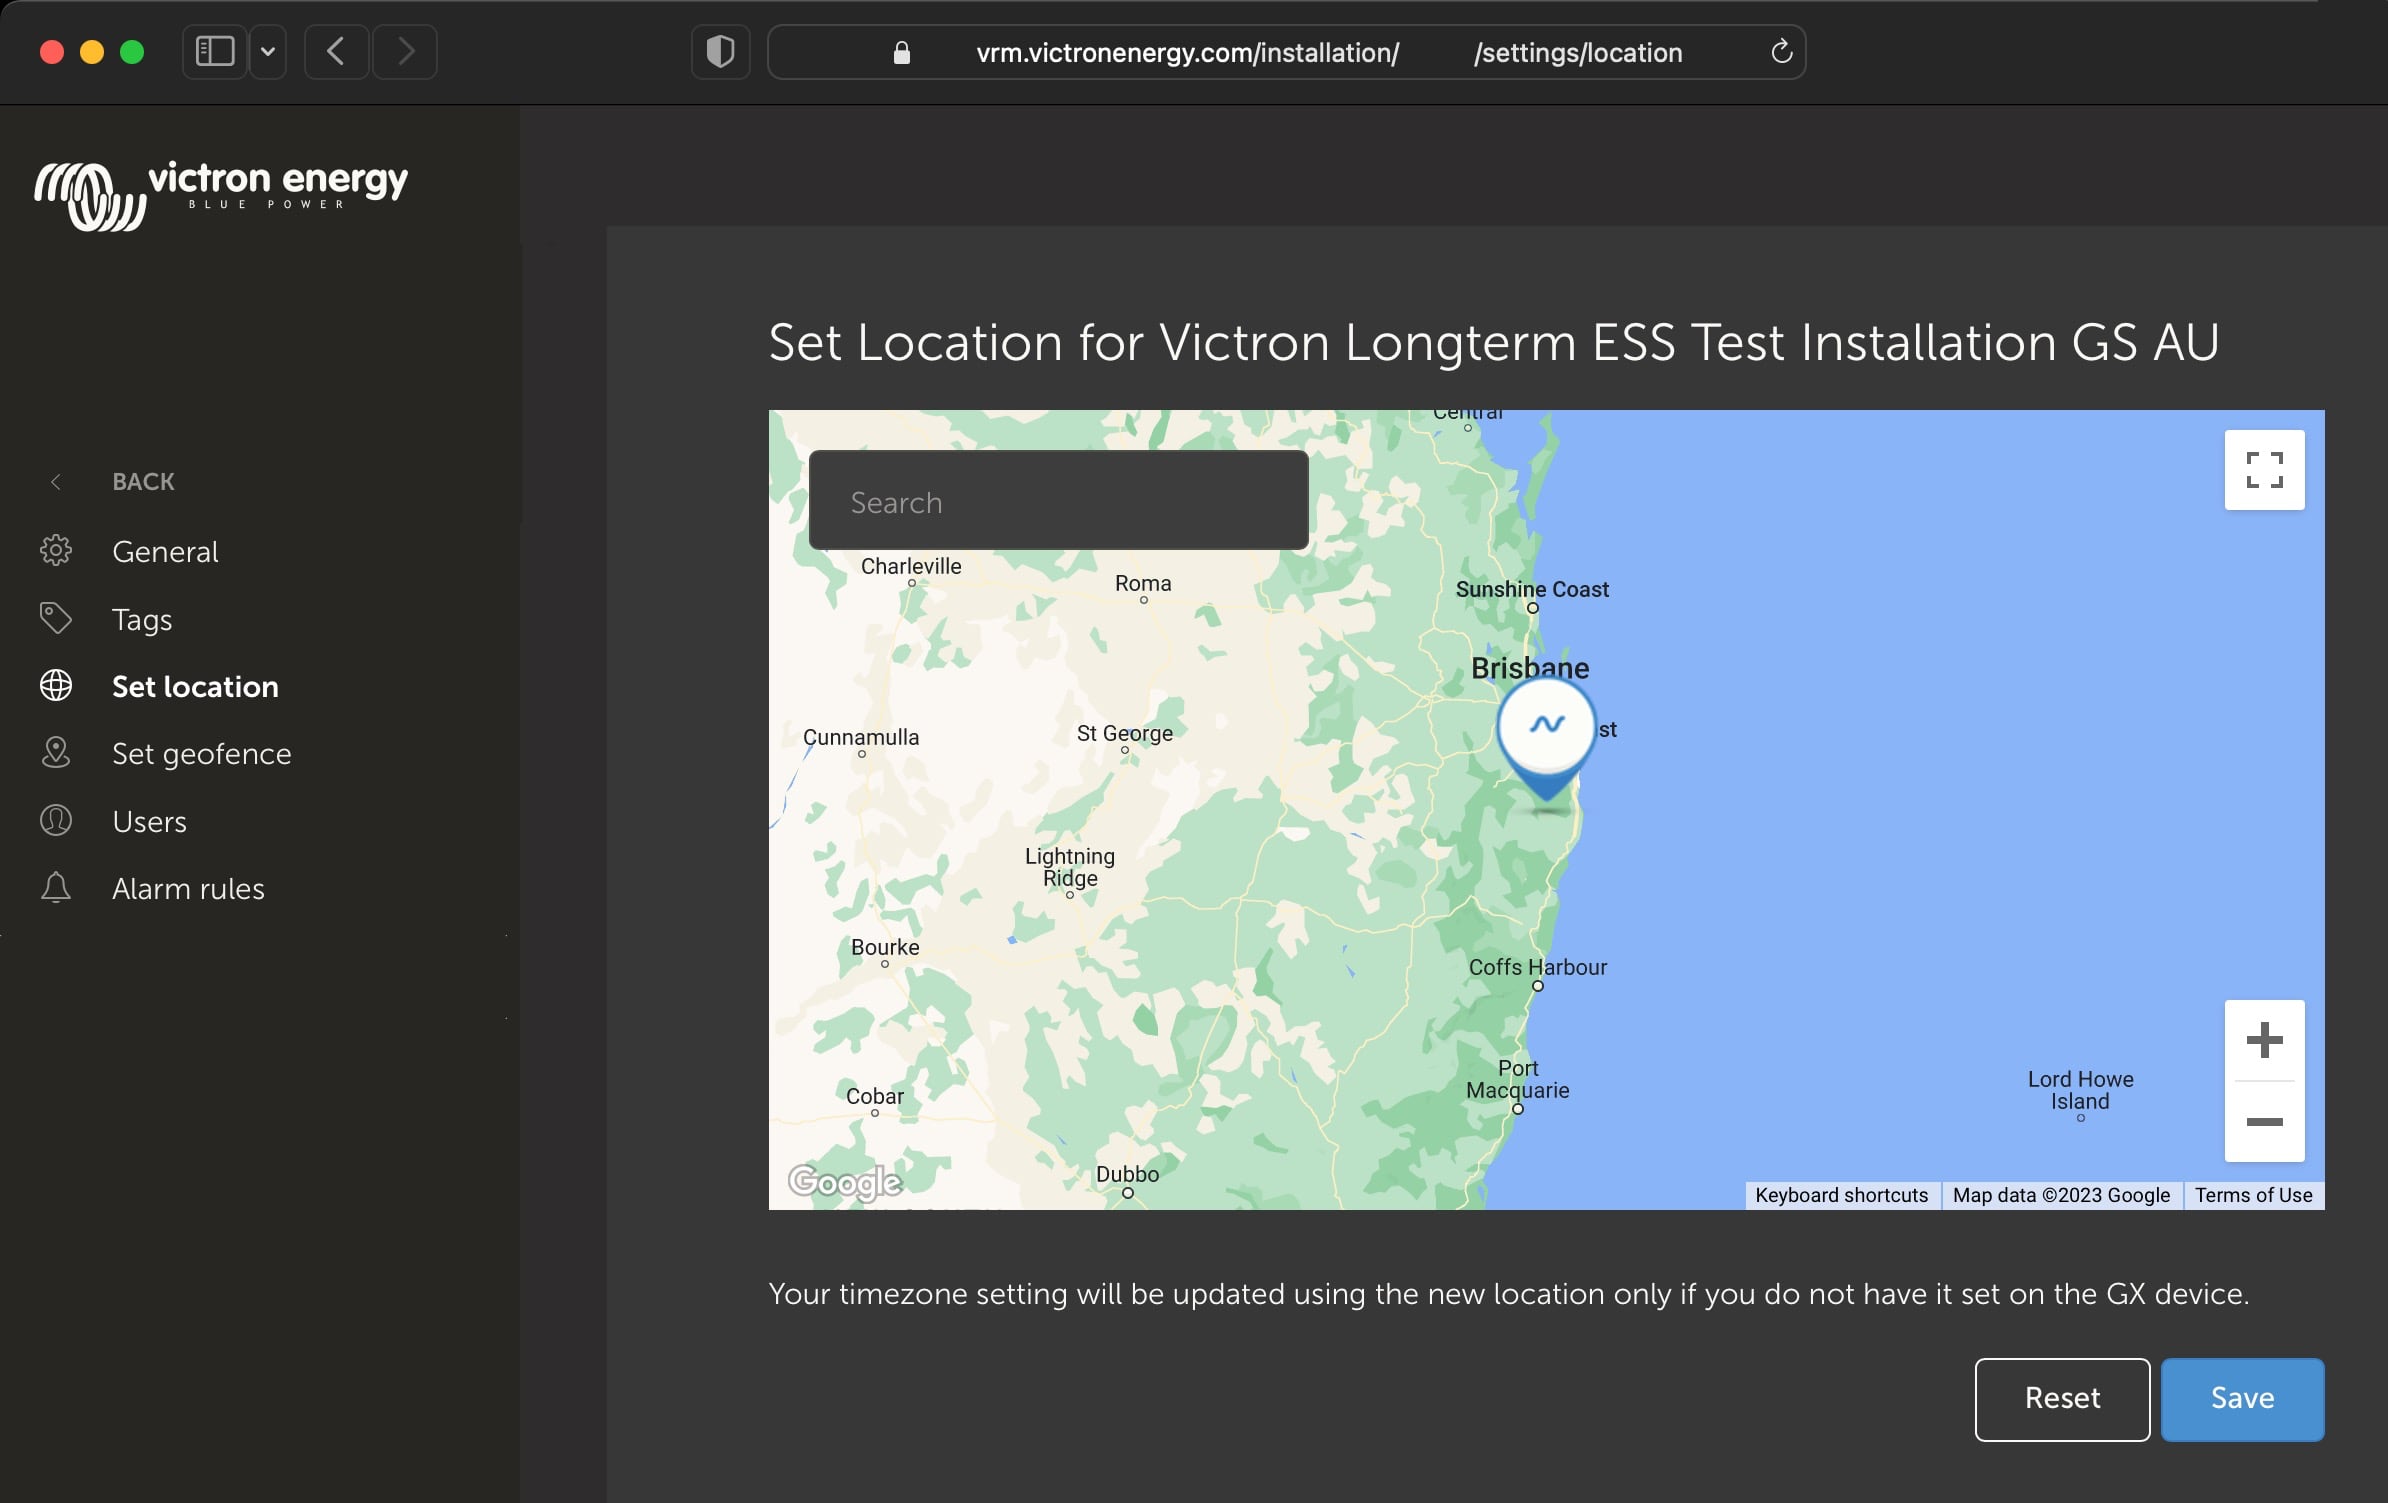
- Your installation has a location set
- Your site is recording hourly solar yield
- You are on the ‘today’ view
For new sites that don’t yet have a solar yield history, or if you’ve only recently set the site location, please wait up to 48 hours for it be enabled and have enough information to be accurate.
This feature uses location data as a 4 km² grid, and doesn’t link any personally identifiable information or co-ordinates of your Victron site. This is accurate enough for the solar data while still maintaining your location privacy.
Showing the forecast adds more information to the Solar info box on the dashboard as well.
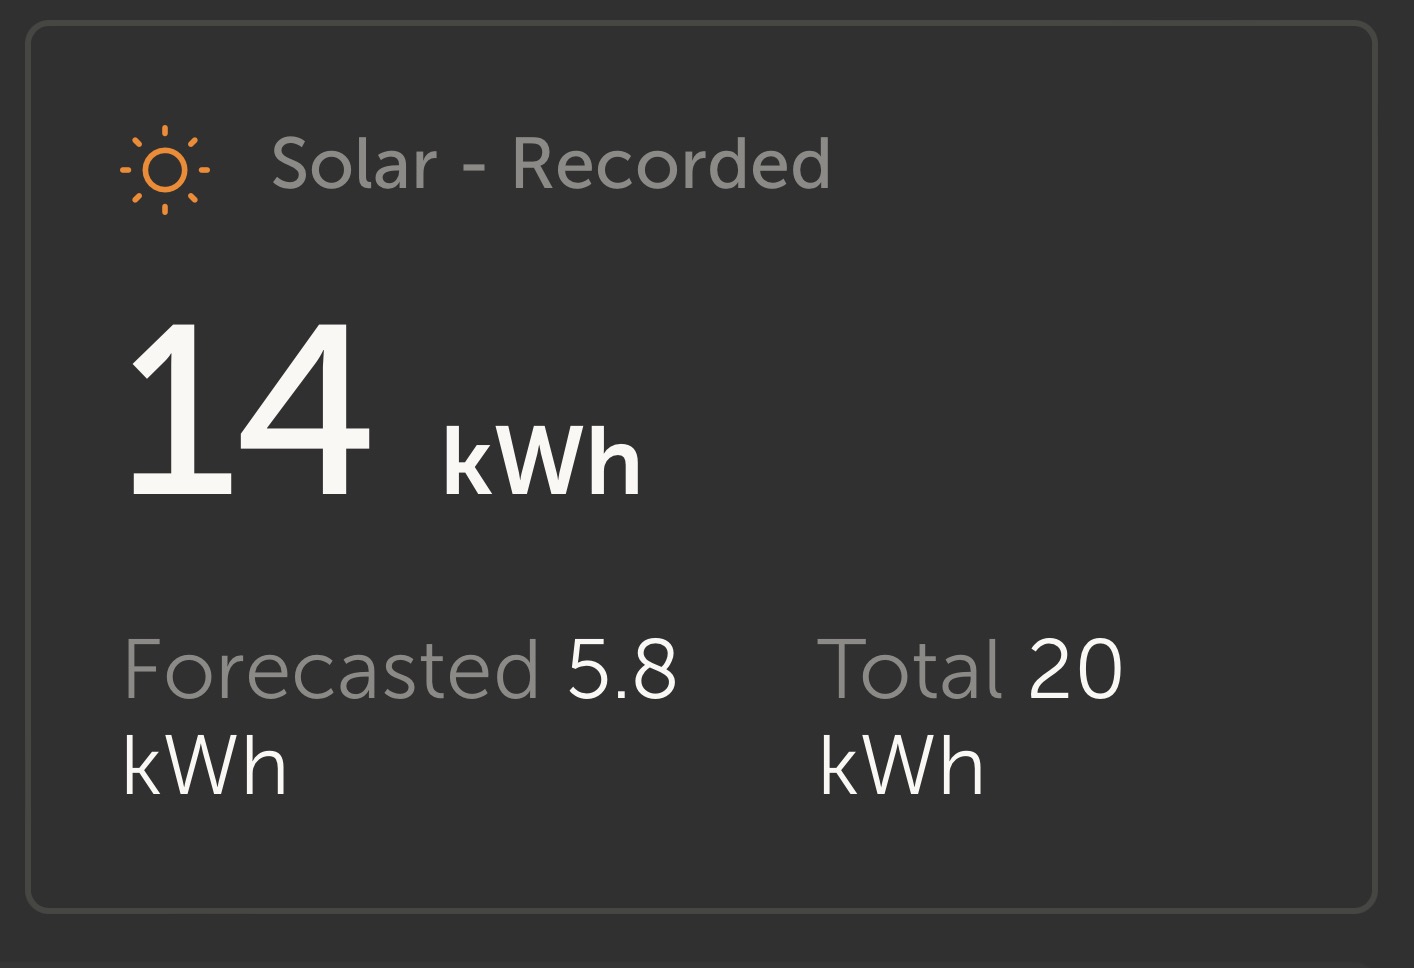
“Solar – Recorded” shows the actual solar energy that has been converted from the sun today.
“Forecasted” is the estimate for how much solar production still remains for the day. This number will count down as the day progresses and the actual yield is added to the “recorded” figure.
“Total” is a forecasted combined value of the forecast estimate and the actual recorded energy.
There might be some rounding of these figures.
How is it done?
We have created a machine learning model that compares historical solar production and the irradiance at the time of day and then calculates the future projected solar production based on the estimated irradiance forecast.
This automatically takes into account factors like system sizing, panel orientation & pitch, efficiency degradation, and shading without requiring any user input.
This means that over time the model will get more accurate, even as panels degrade and trees grow.
The model goes even further, accounting for when MPPT trackers were at maximum production, or limiting themselves (for example when batteries are full in an off-grid system).
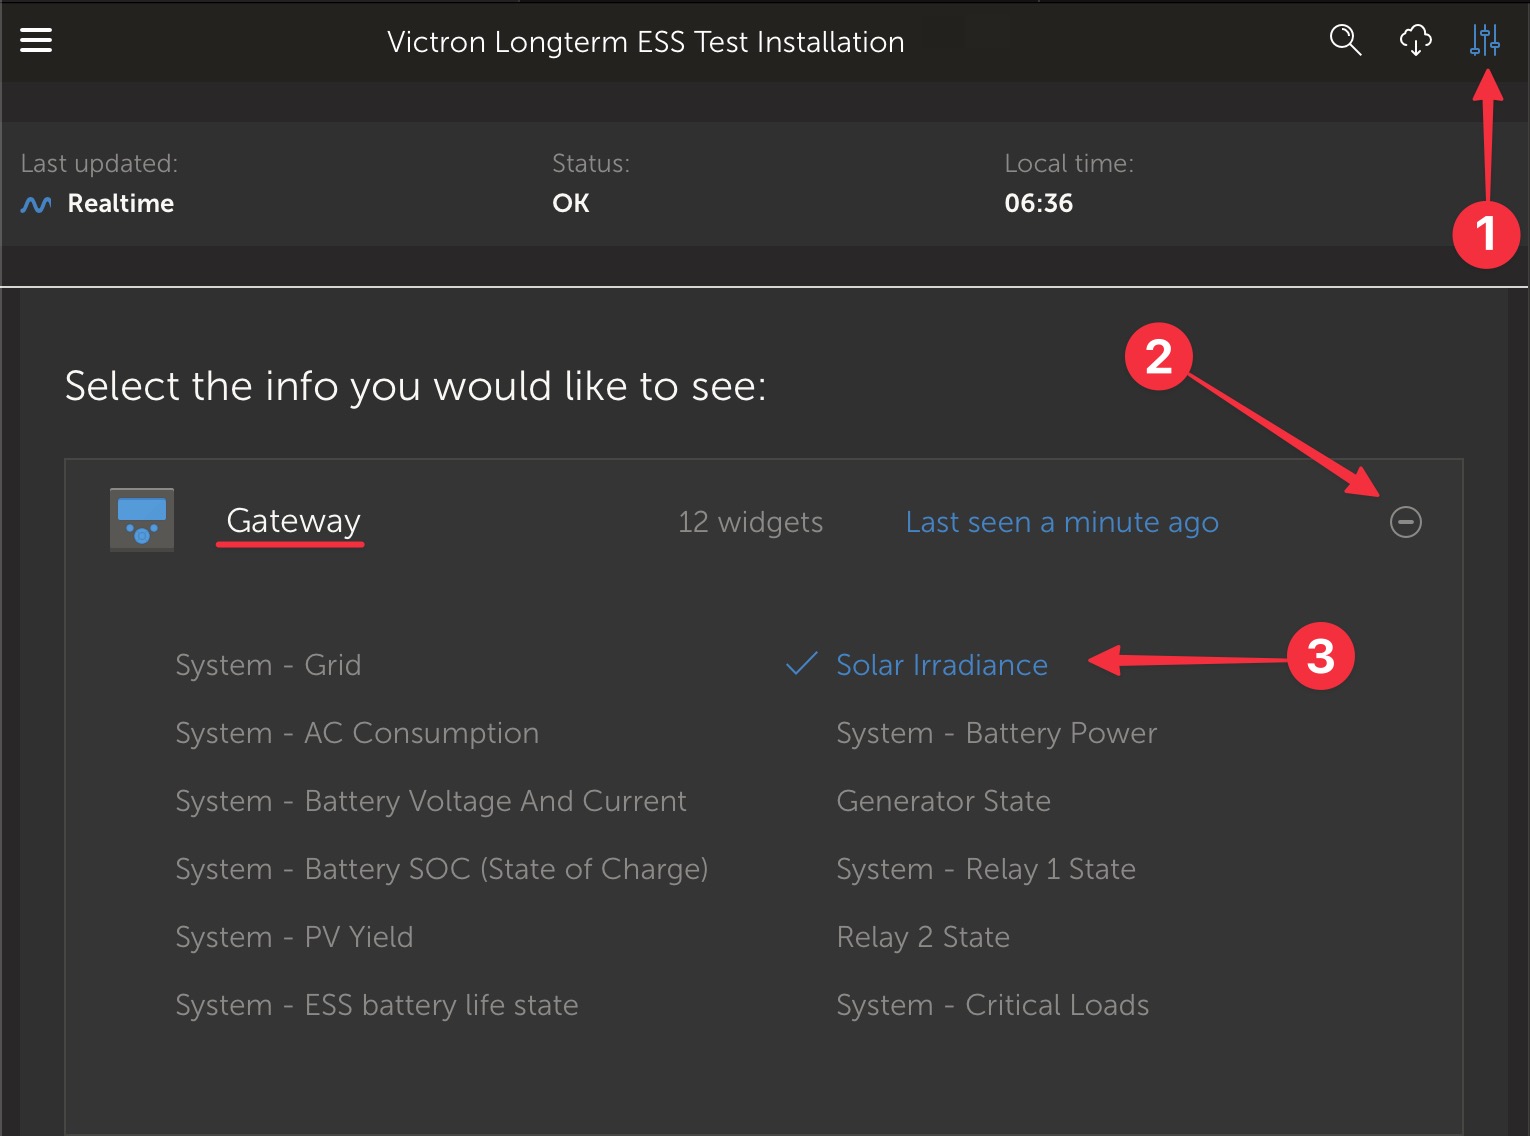
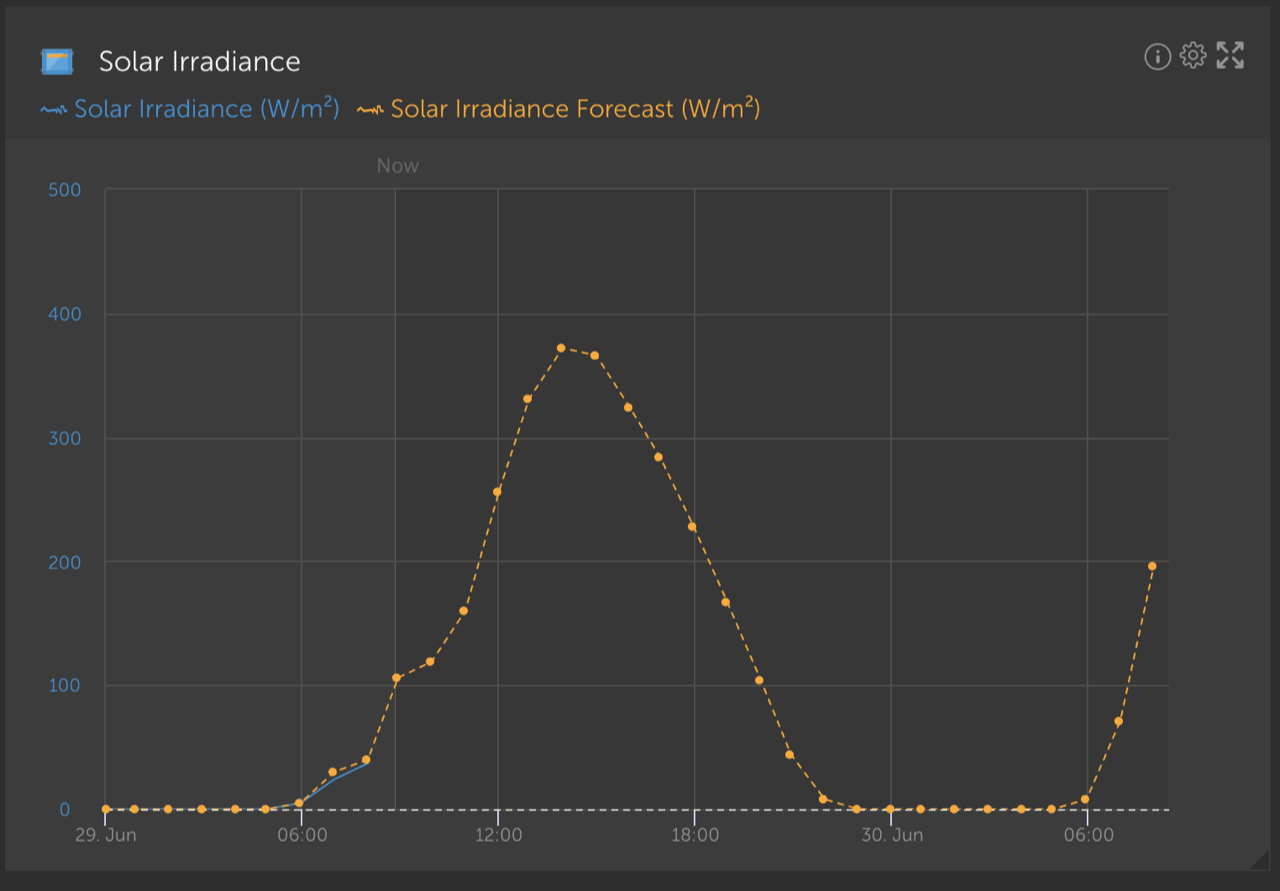
In addition to the dashboard estimate, we also have the underlying Solar Irradiance Forecast (W/m²) available as a new advanced VRM widget.
Like the dashboard, in the ‘Today’ time frame view, this widget operates slightly differently to the rest and will expand out its time x-axis to include the whole 24 hours so you can see the estimate for that day.
A future update for additional advanced VRM widgets will show the estimated production for each individual MPPT tracker.
More functionality planned
Testing is already well underway for how this new functionality can extended further, such as longer range forecasts and improving the performance of Victron systems in other ways.
For example as part of a ‘Dynamic ESS‘ system that can take energy pricing information, combined with expectations of solar yield and decide whether to discharge or recharge the battery.
It is currently not possible to see the estimates in the VRM phone app widgets. We are working on this for a later release.
We’ll make another announcement with more details about these in the future.
Going further with Node-RED controls
For those who are interested in pushing further with this new solar yield estimate data from VRM for themselves, there is the possibility to integrate with Node-RED.
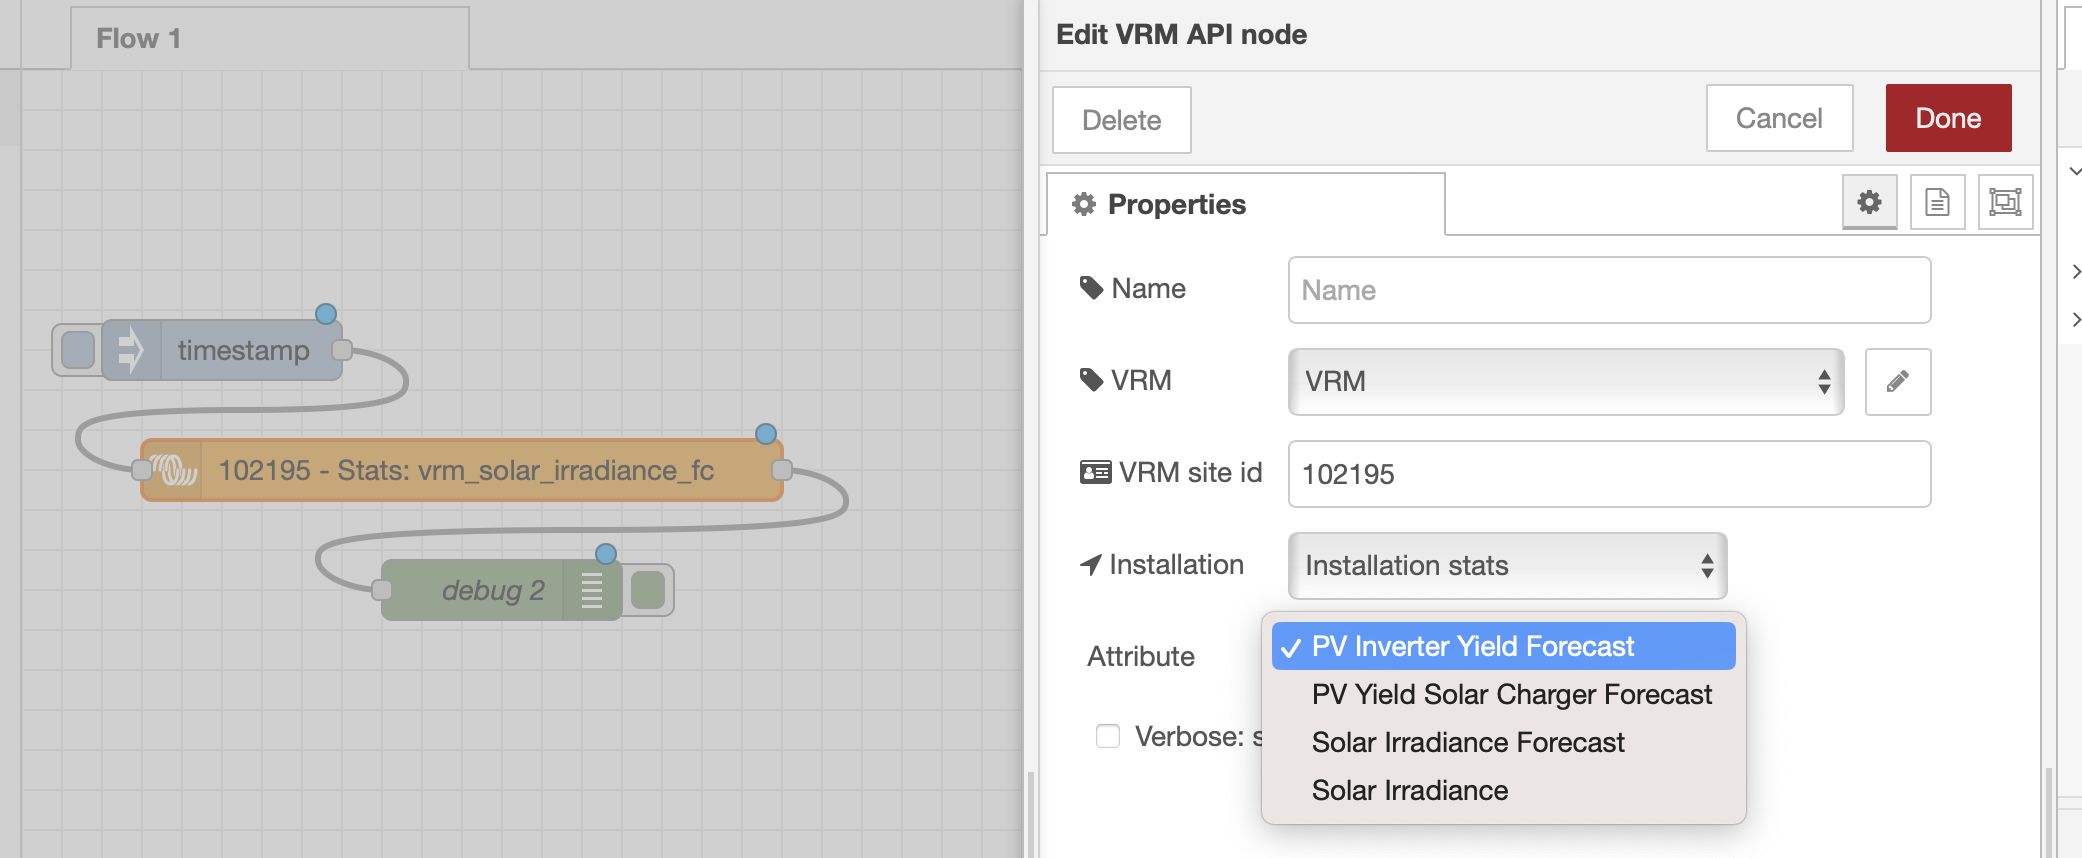
For example the system could be programmed to trigger a relay control for a high load appliance based on the expectation of sufficient solar yield later that day to recharge the battery.
Documentation on how to get started using data from VRM in your Node-RED flows is here.
Once up and running there is even more detailed specific Node-RED estimated yield flow documentation here.
As always with leading edge development like Node-RED the best place to find out more is via the Modifications space on Victron Community.
Limitations
Sites with these RS products may show less accurate estimates if there are other sources of solar production, or no forecast at all if they are the only source of solar production. We are working now to add full support for them in the near future.
Feedback
Please report any issues with the user interface, either suggestions for improvement or bugs. We are still improving the estimation algorithm, so are interested in reports of any unusual or impossible estimates.
We hope you enjoy this new feature, and are looking forward to hearing your feedback.


