
For fleet owners managing multiple installations, the new VRM Fleet Dashboard offers a clearer and faster way to stay on top of your sites.
Until now, there wasn’t really a place on VRM where you could see how your entire fleet was doing at a glance. This was especially challenging for those managing 10 sites or more. The installation overview page provides detailed information, but for fleet managers with hundreds of installations, spotting potential issues often meant manually filtering through sites. And when it came to fault finding, they had to check each site one by one, which could be a very time-consuming process. The new Fleet Dashboard changes that.
Designed to make things easier
Our development team uses the VRM portal every day, just like many other Victron users. They’re always looking for ways to make the experience smoother, so you can start your workday with more clarity and less clicking. So when a team member said,
“As a fleet owner, I want to land on a VRM homepage that gives me at-a-glance info on my fleet, so I can quickly dive deeper into other parts of VRM,”
it became the starting point for the new Fleet Dashboard: a clear overview of all installations that shows you what’s going on with your fleet right away.
Alarms
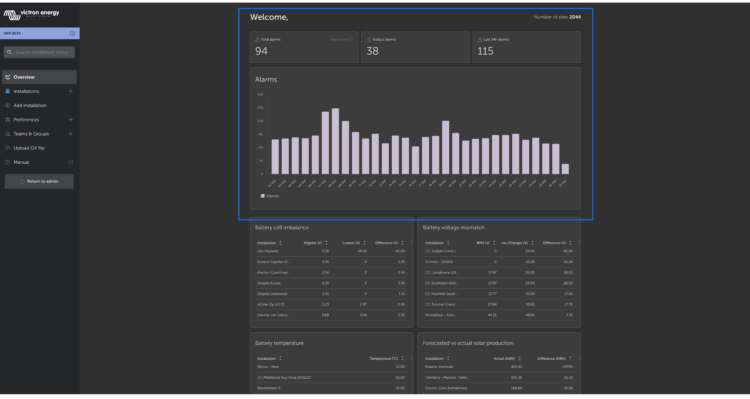
VRM Fleet Dashboard- alarms
Fleet owners now land on a homepage that gives an instant overview of system status. At the top of the page, you’ll see:
- Total active alarms
- New alarms today
- Alarms in the past 24 hours
Clicking on the active alarms takes you straight to the installation overview, which is already filtered to only show the sites with issues.
The dashboard also includes a calendar-style graph that helps you identify patterns or recurring alarms over time.
Insights

VRM Fleet Dashboard – insights
Scrolling down, the dashboard presents a range of detailed insights across all installations:
- Battery cell imbalance
Identify early signs of degradation by spotting voltage differences between cells. - Battery voltage mismatch
Detect gaps between BMS and inverter or charger readings that could point to wiring or communication issues. - Forecasted vs actual solar production
Compare expected and actual solar yield. - Battery temperature
Monitor for unusually high or low temperatures that could affect performance or lifespan. - Disconnected devices
Quickly see which installations have devices that are no longer reporting. - Generator service expiration
Stay ahead of maintenance by tracking generator runtime until the next service. - Generator inactivity
Identify generators that have not run for a while and may need attention.
Each installation shown in these insights can be pinned to the top for quick access, or snoozed if it doesn’t need immediate attention.
What’s next
We believe the new Fleet Dashboard is a valuable addition to the VRM portal for anyone managing 30 or more sites. It saves time, gives a clear overview of all installations, and helps you catch issues before they turn into bigger problems.
We hope it makes your life a little easier. We’re always working to improve how you monitor and manage your systems, and your feedback plays a big part in what comes next. If you have any thoughts, ideas or suggestions, we’d love to hear from you on the Victron Community.


