Good morning!
Faster, better graphs and better navigation. And a fresh set of colours. For all of us that are familiar with the old site, this new one might take a bit of getting used to. It did for me at least (smile). But, I promise you: it’s worth it.
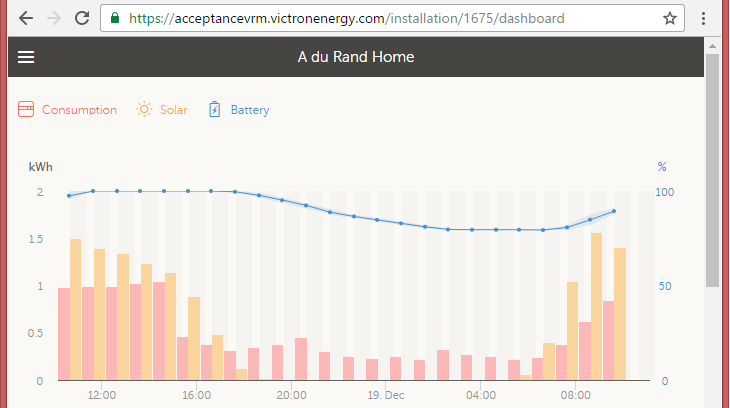
For me, the new speed, and also the integrated graph on the dashboard is what I like most. The screenshot above shows that graph. The red bars show the consumption, the yellow bars show the solar yield. With one bar per hour now, which is much easier to interpret than the two-hour bars we had in the previous version. Also, overlaid on the same graph, you can see the state of charge in blue.
Lets go through a few screenshots, showing the new features and changes:
More details on the main graph
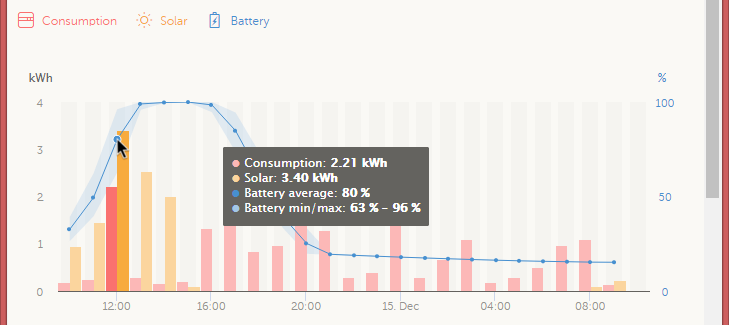
Hovering the mouse over a point in the graphs shows all the details of that hour. Including the range of the SOC for that hour. This is also visible in the graph and is shown by the light blue shade.
Notes & photos
New, it is now possible to add notes to every installation. Useful to keep track of installation dates and other dates, as I have done here for my own install:
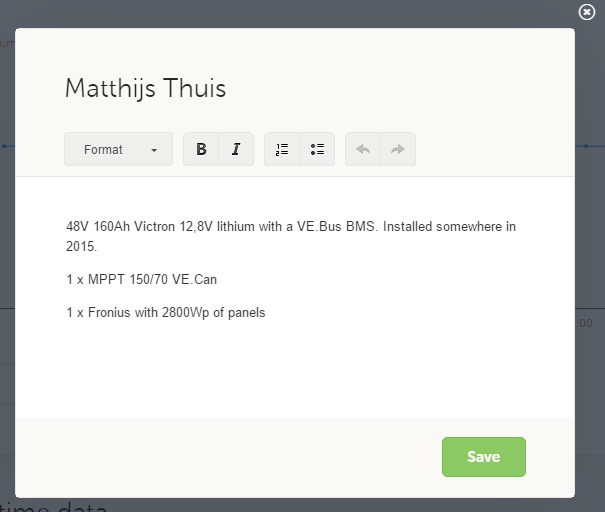
Photos can be added too, just as you can with the VRM App.
New: system battery graphs on the advanced tab
In a typical system, there are many devices measuring similar data. For example battery voltage is measured by almost every device in a system. The Color Control selects the best measurements, and shows them on its Overview. Now you can see those same graphs on the Advanced tab:
- System Battery SOC
- System Battery Voltage & Current
- System Battery Power
I recommend to use these graphs and add them to the top of your advanced tab.
Details & conclusion
-
Facelift of the entire user interface:
-
Google map is by default not shown, and not loaded. Still accessible: see globe icon on top right.
-
Reduced number of tabs: consumption and solar yield tab are now integrated into the main tab, Dashboard.
-
Navigation is now all in one place; the menu on the left.
-
Improved loading & browsing speed.
-
Improved the mobile version, used on smartphones & tablets.
-
-
The default date ranges are now last 24 hours, last 7 days, last 30 days and last 12 months.
- Energy graphs show a bar per hour, instead of a bar per two hours.
-
The graphing engine, jqplot, has been replaced with highcharts: the graphs look better.
-
Ability to add written notes and also pictures to an installation. See icons on top-right when looking at the Dashboard tab. The images are the same as visible via the VRM App.
-
The summary widget has been removed.
- Added the System battery widgets.
Don’t forget to update to the new Android and iOS VRM app versions, which are needed to make the login work. There are no other changes to the app.
That’s it, enjoy! You are welcome to leave any questions and suggestions in the comments below.
Best regards,
Matthijs


