In part three of our series of blogs introducing extended features for our system management apps – the worldwide interface VRM, and VictronConnect for on-site control – we’re going to tell you about the new Stored Trends tool.
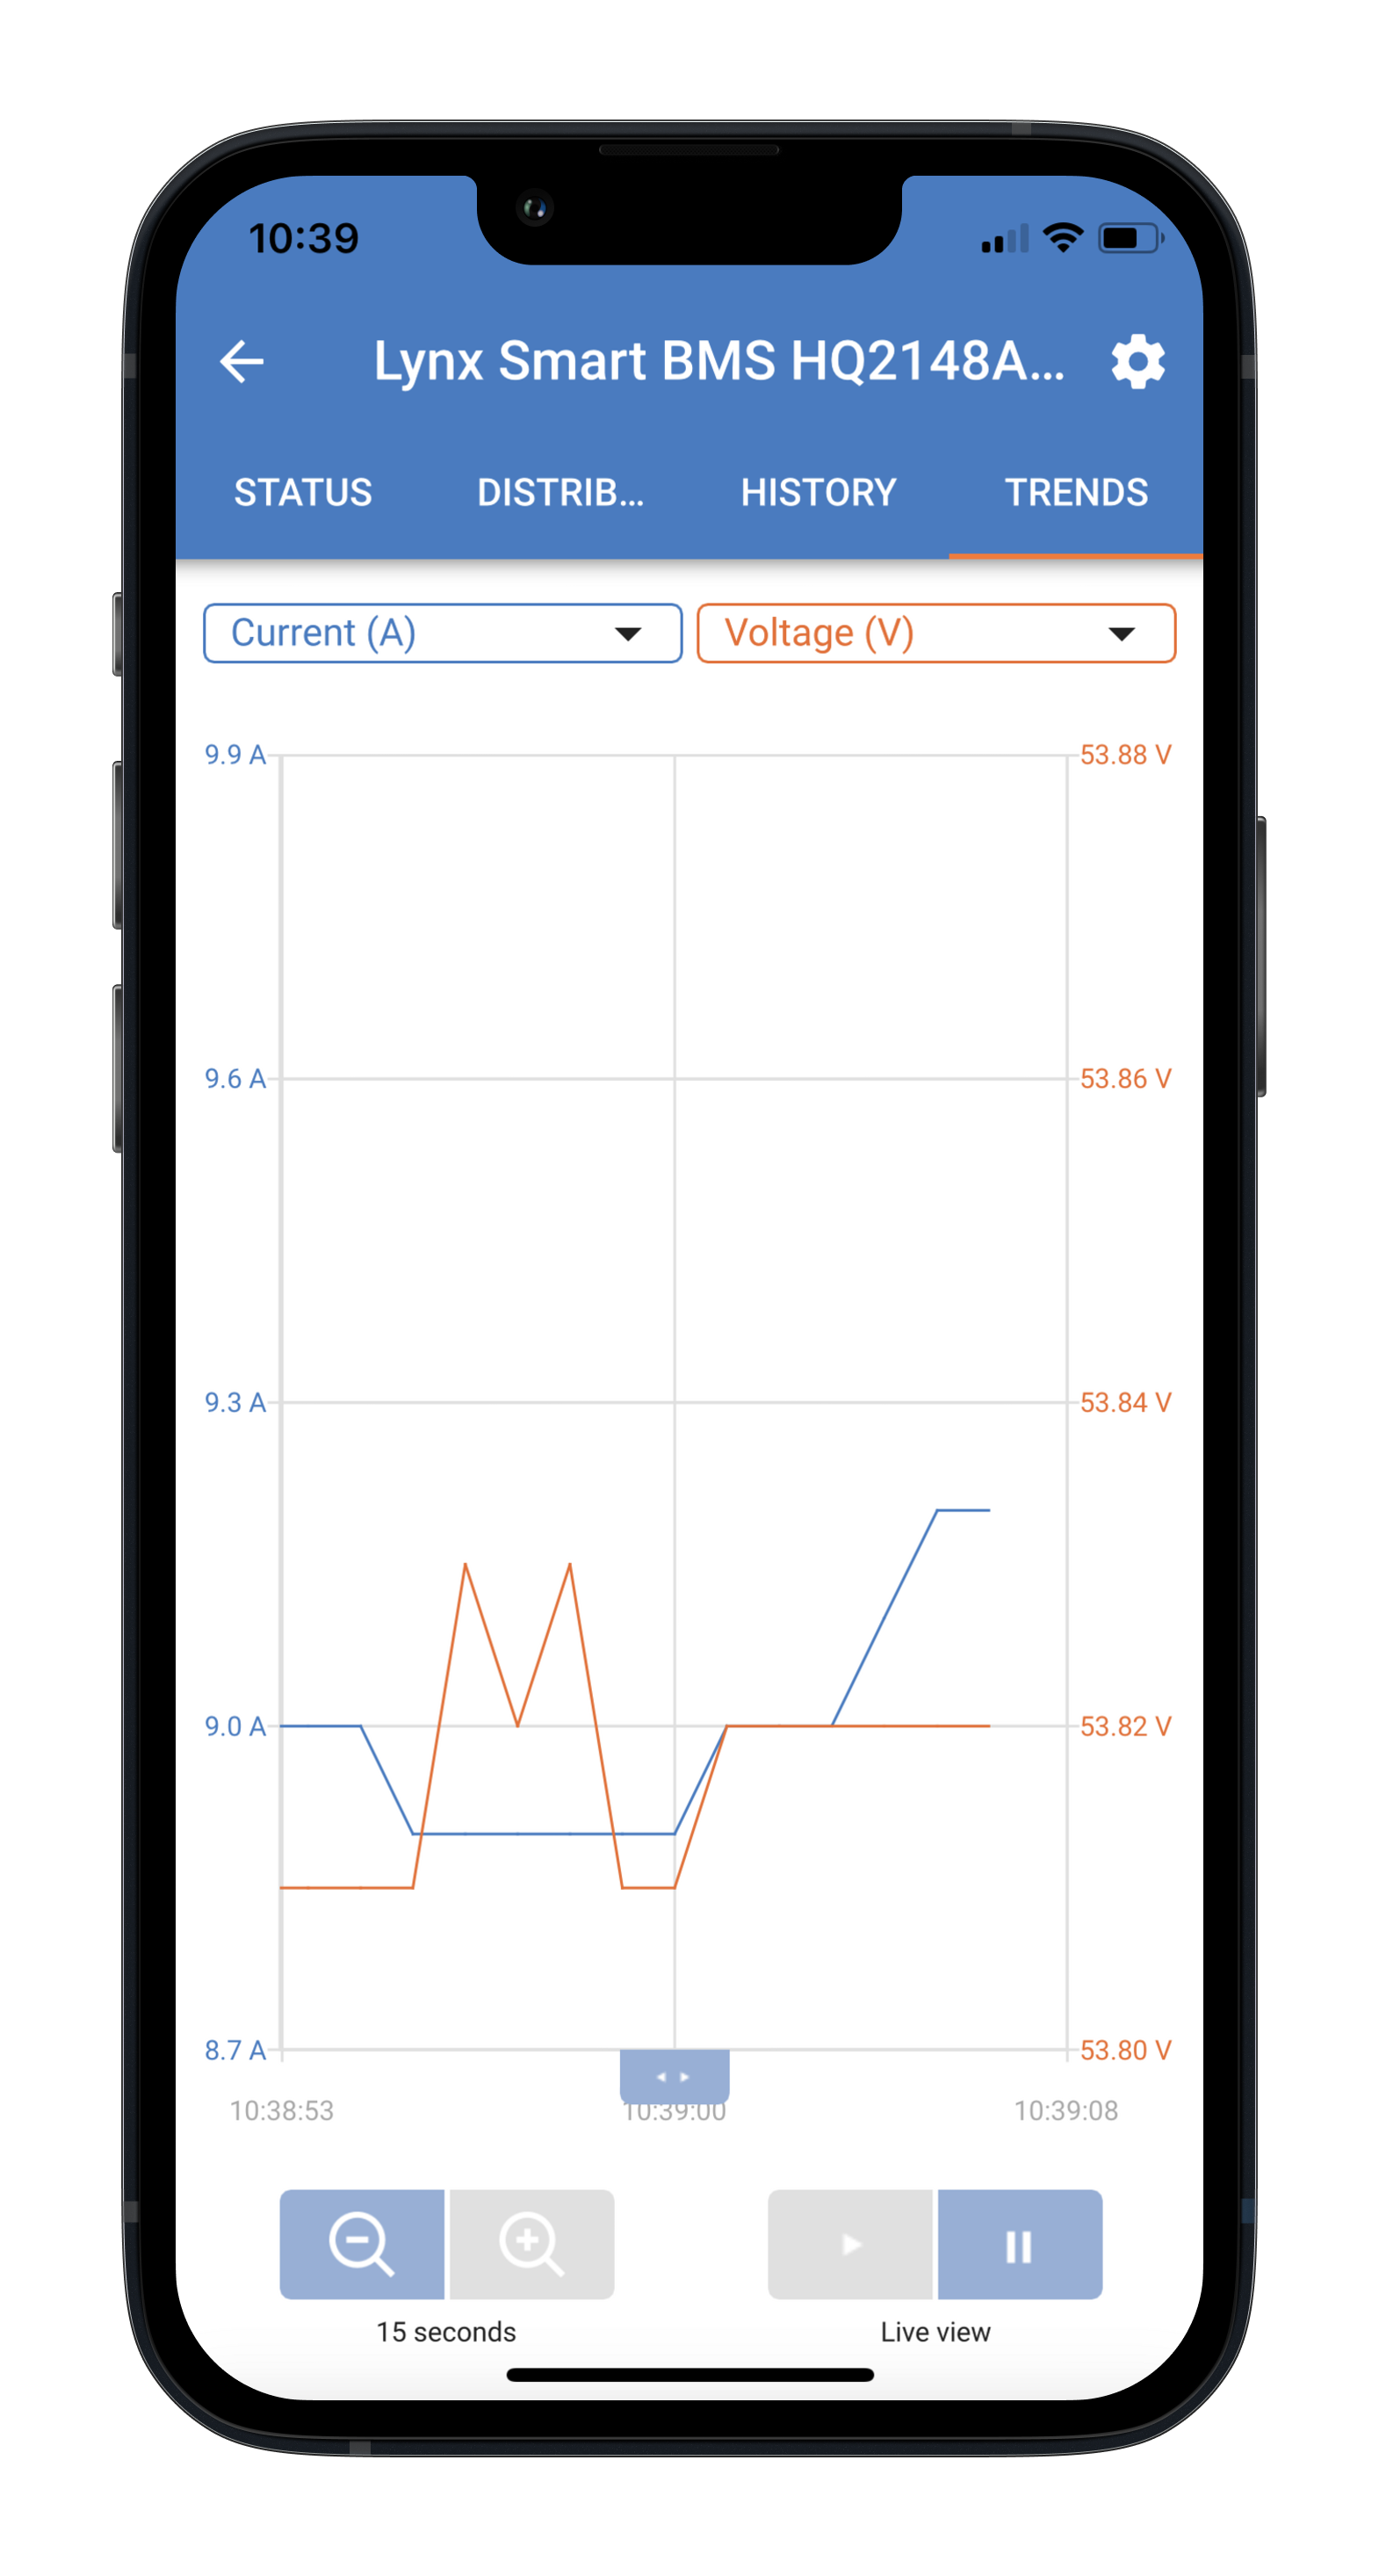
You’ve probably discovered the Trends feature in VictronConnect which is available for devices such as Battery Monitors and Solar Charge Controllers? It offers a graphic presentation of realtime data, and allows you to observe and compare the interaction between two data sources. The data flow can also be paused for more considered analysis.
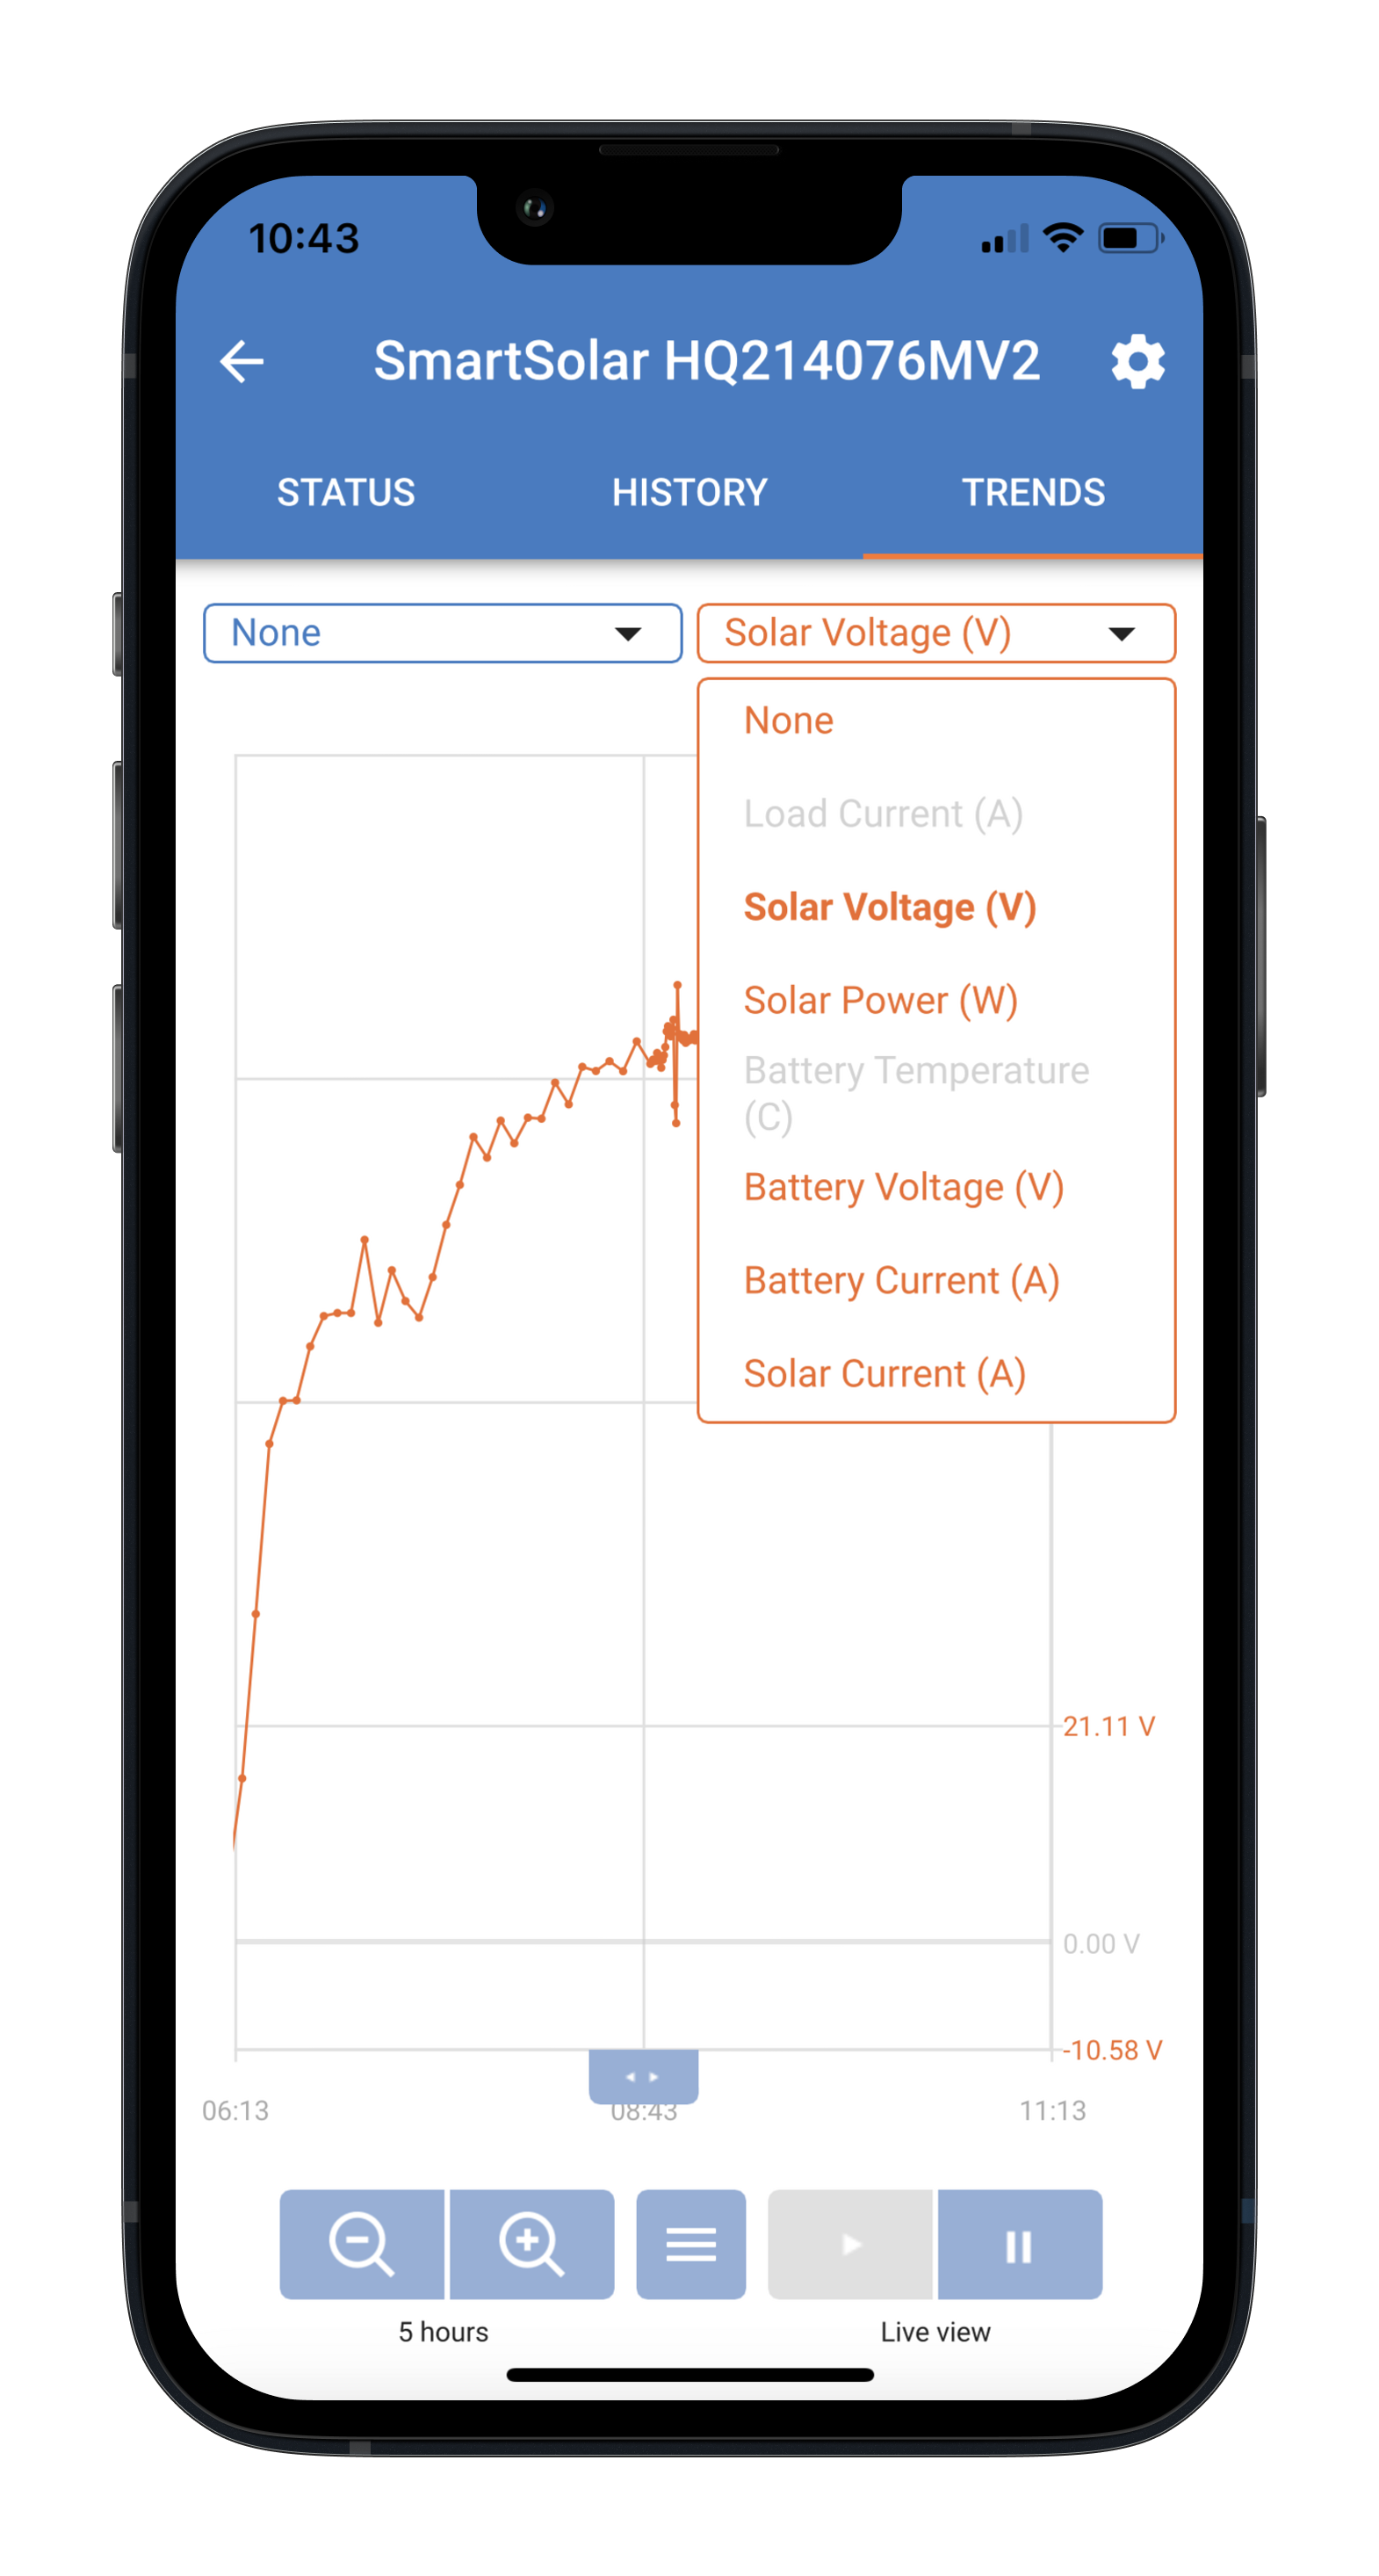
A solar charge controller, for example, allows users to monitor two traces from the following data inputs:
- Load Current
- Solar Voltage
- Solar Power
- Battery temperature
- Battery Voltage
- Battery Current
- Solar Current
Interrogate the Trend history
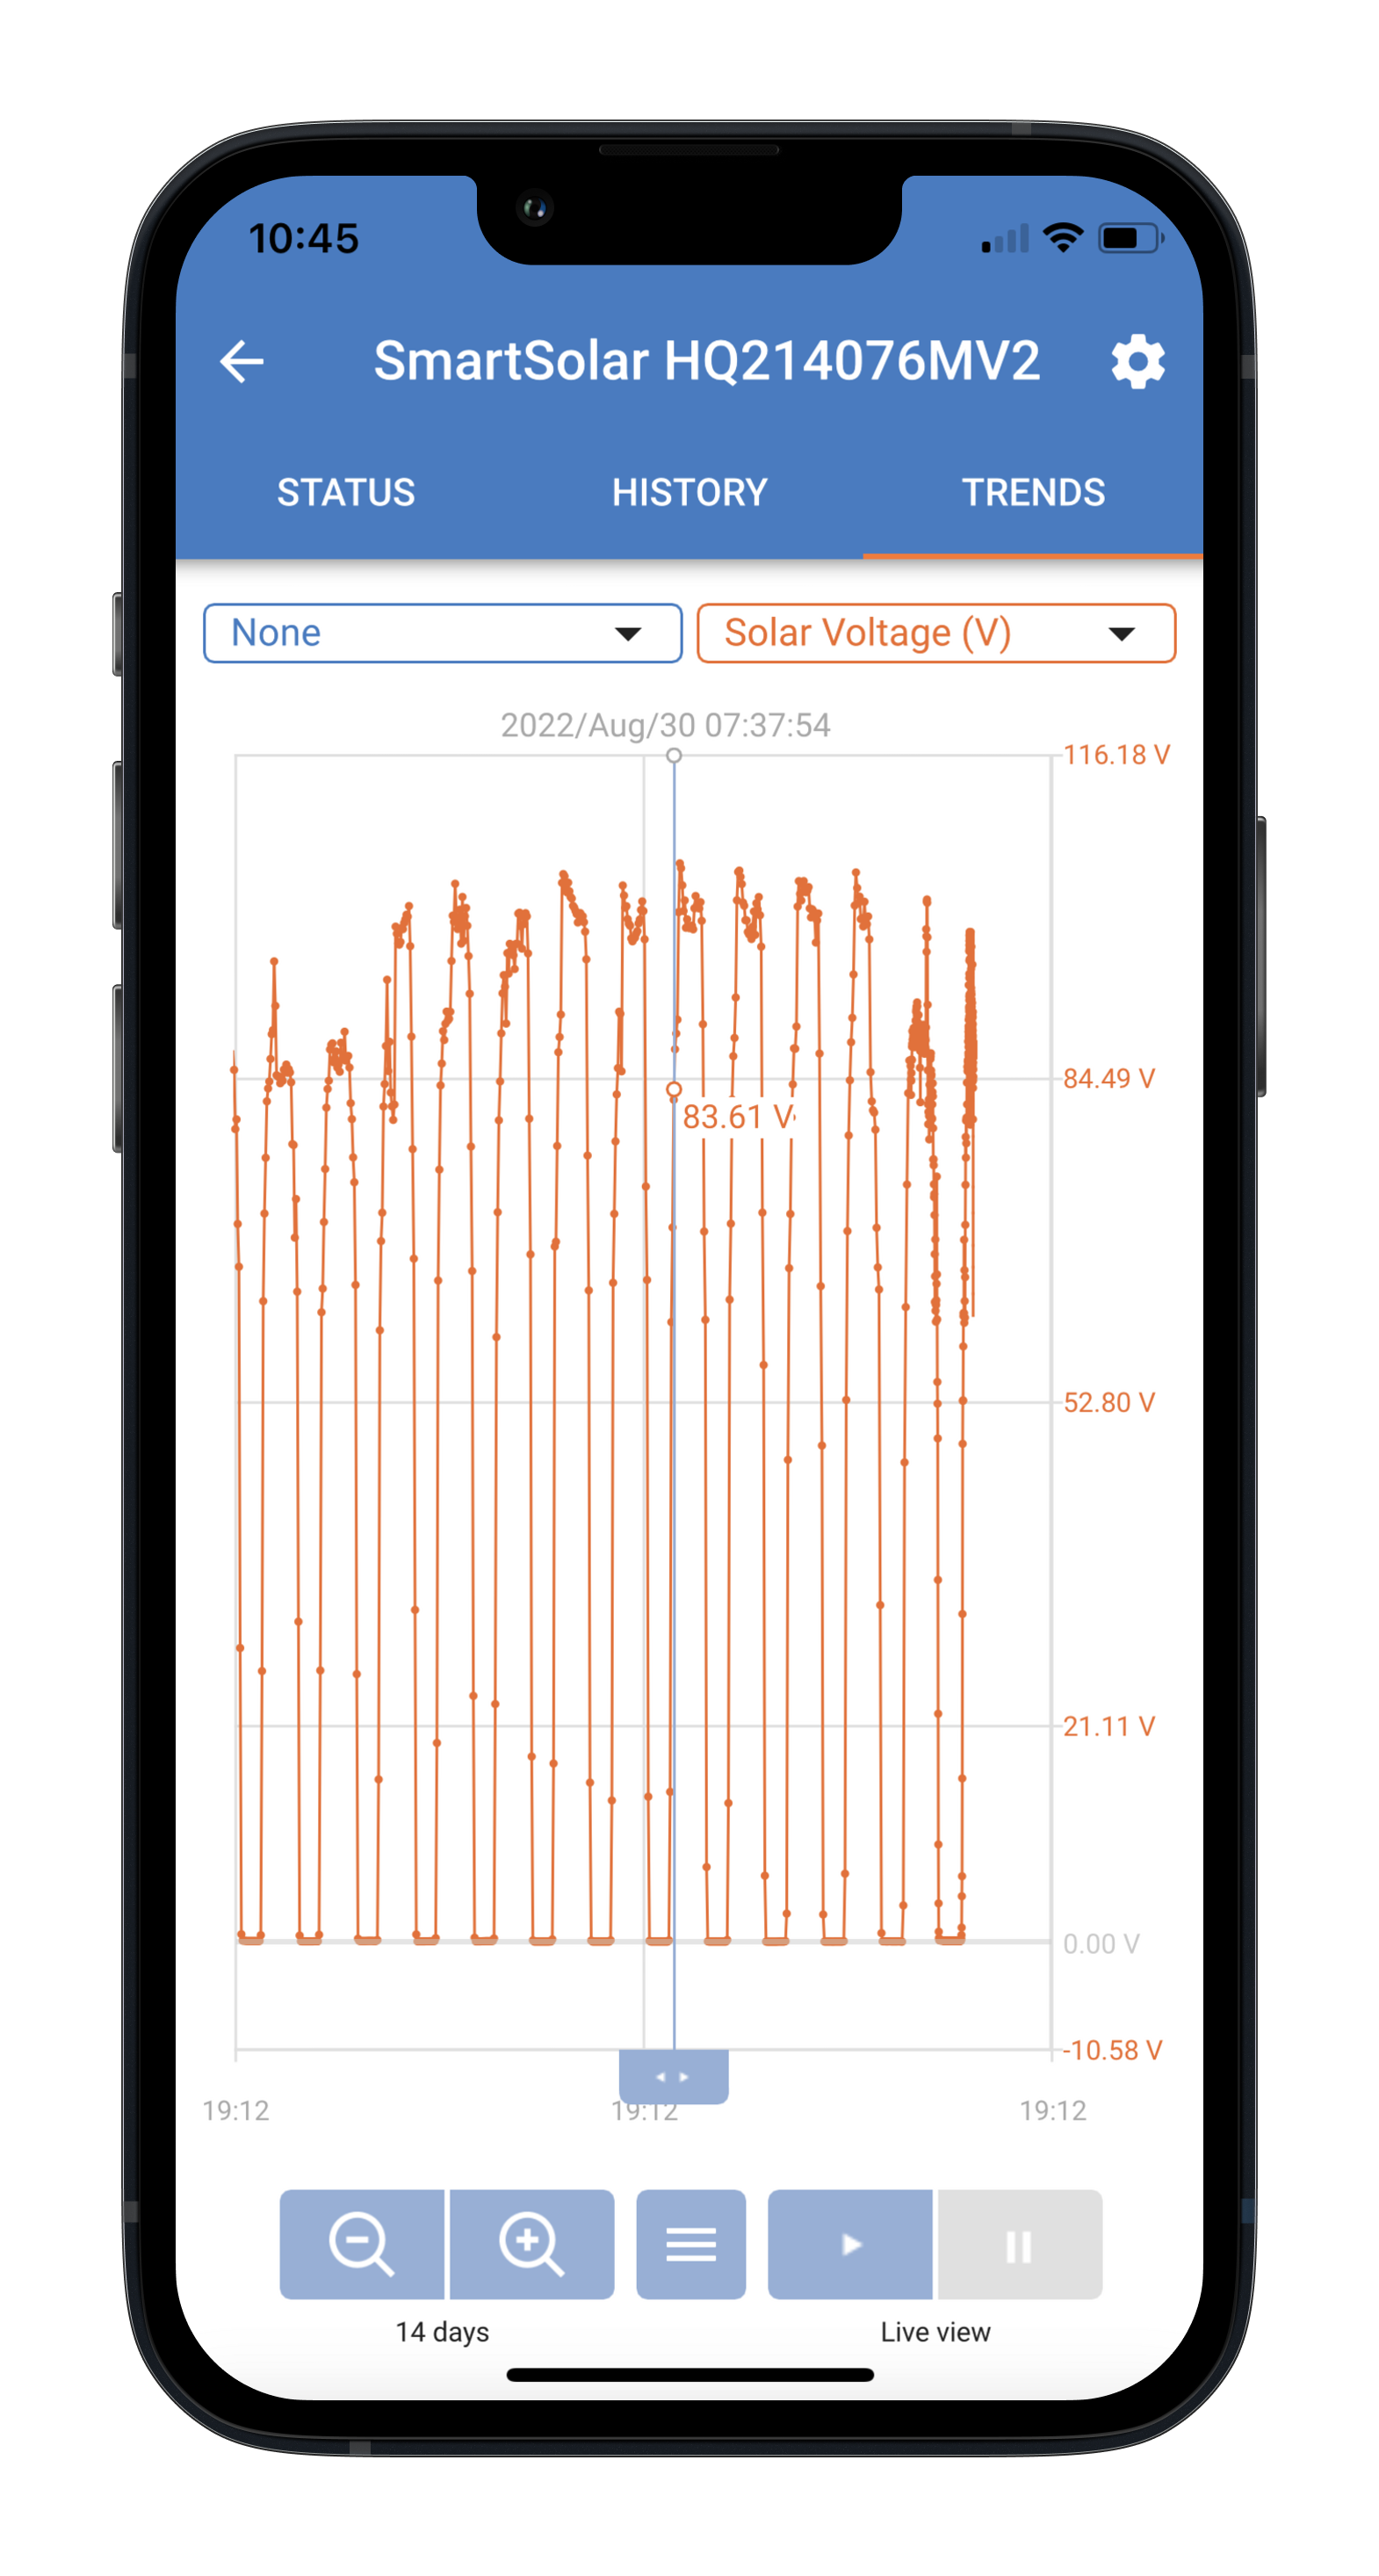
What’s new is that we’ve recently added Trend data storage – allowing you to observe the graph history over the past 45 days – or as long as six months in the case of the Smart Battery Sense.
The observation period can be chosen by using the magnifying tool – screen bottom-left (See above) – the minus button takes you back through time, and the plus button advances.
This powerful record allows you to observe the performance of your installation before and after some significant change – adding a new device, perhaps – or seasonal changes; changing from lead to lithium; increasing charging ability, battery capacity …or load.
The period of observation available is from between 15 seconds to 45 days (180 days for Smart Battery Sense). Between those two extremes there are twenty incremental steps. At maximum history span, the recorded observation interval is 30 minutes.
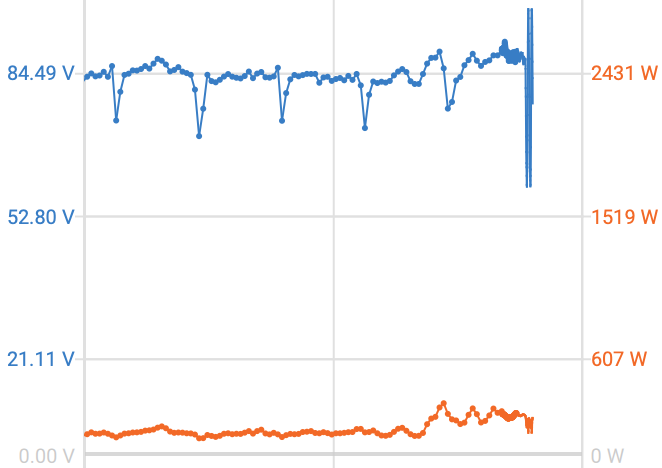
Stored Trend trace lines are dotted at the moment of data collection – live data has a clear trace.
Analysis of the actual performance over a period of time allows you to make informed decisions for the future management of your system.
Watch our Video demonstration of the Stored Trends feature here:
Knowledge is power
Try the Stored Trends feature next time you’re using VictronConnect. Real-world analysis is a powerful tool which provides you with information a ‘Snapshot’ never can!