 Add this page to your book
  Remove this page from your book
  Manage book (
 Help
Help Table of Contents
VRM Portal - Dashboard
1.Introduction & available information
The dashboard is the main page. It shows all information on the installation at a glance.
1.1 Introduction video
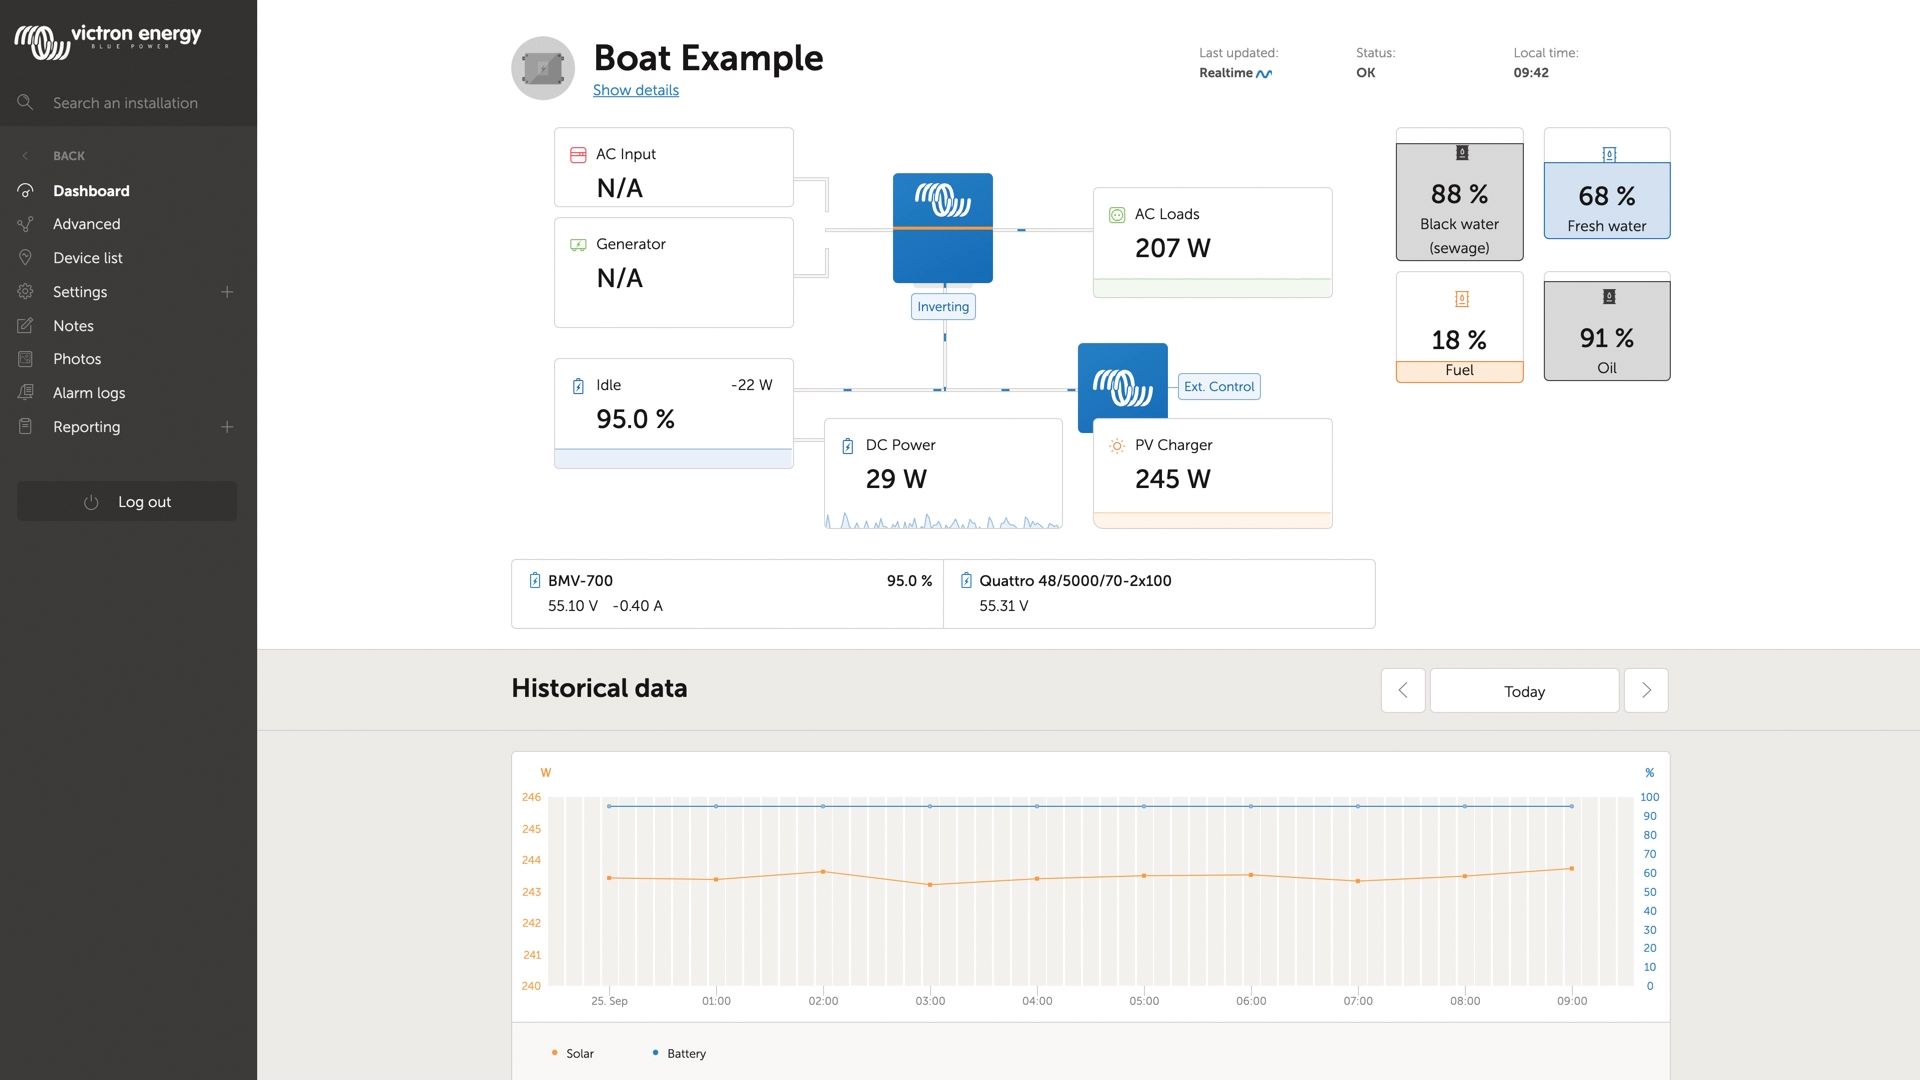
1.2 Example screenshot for yacht installation
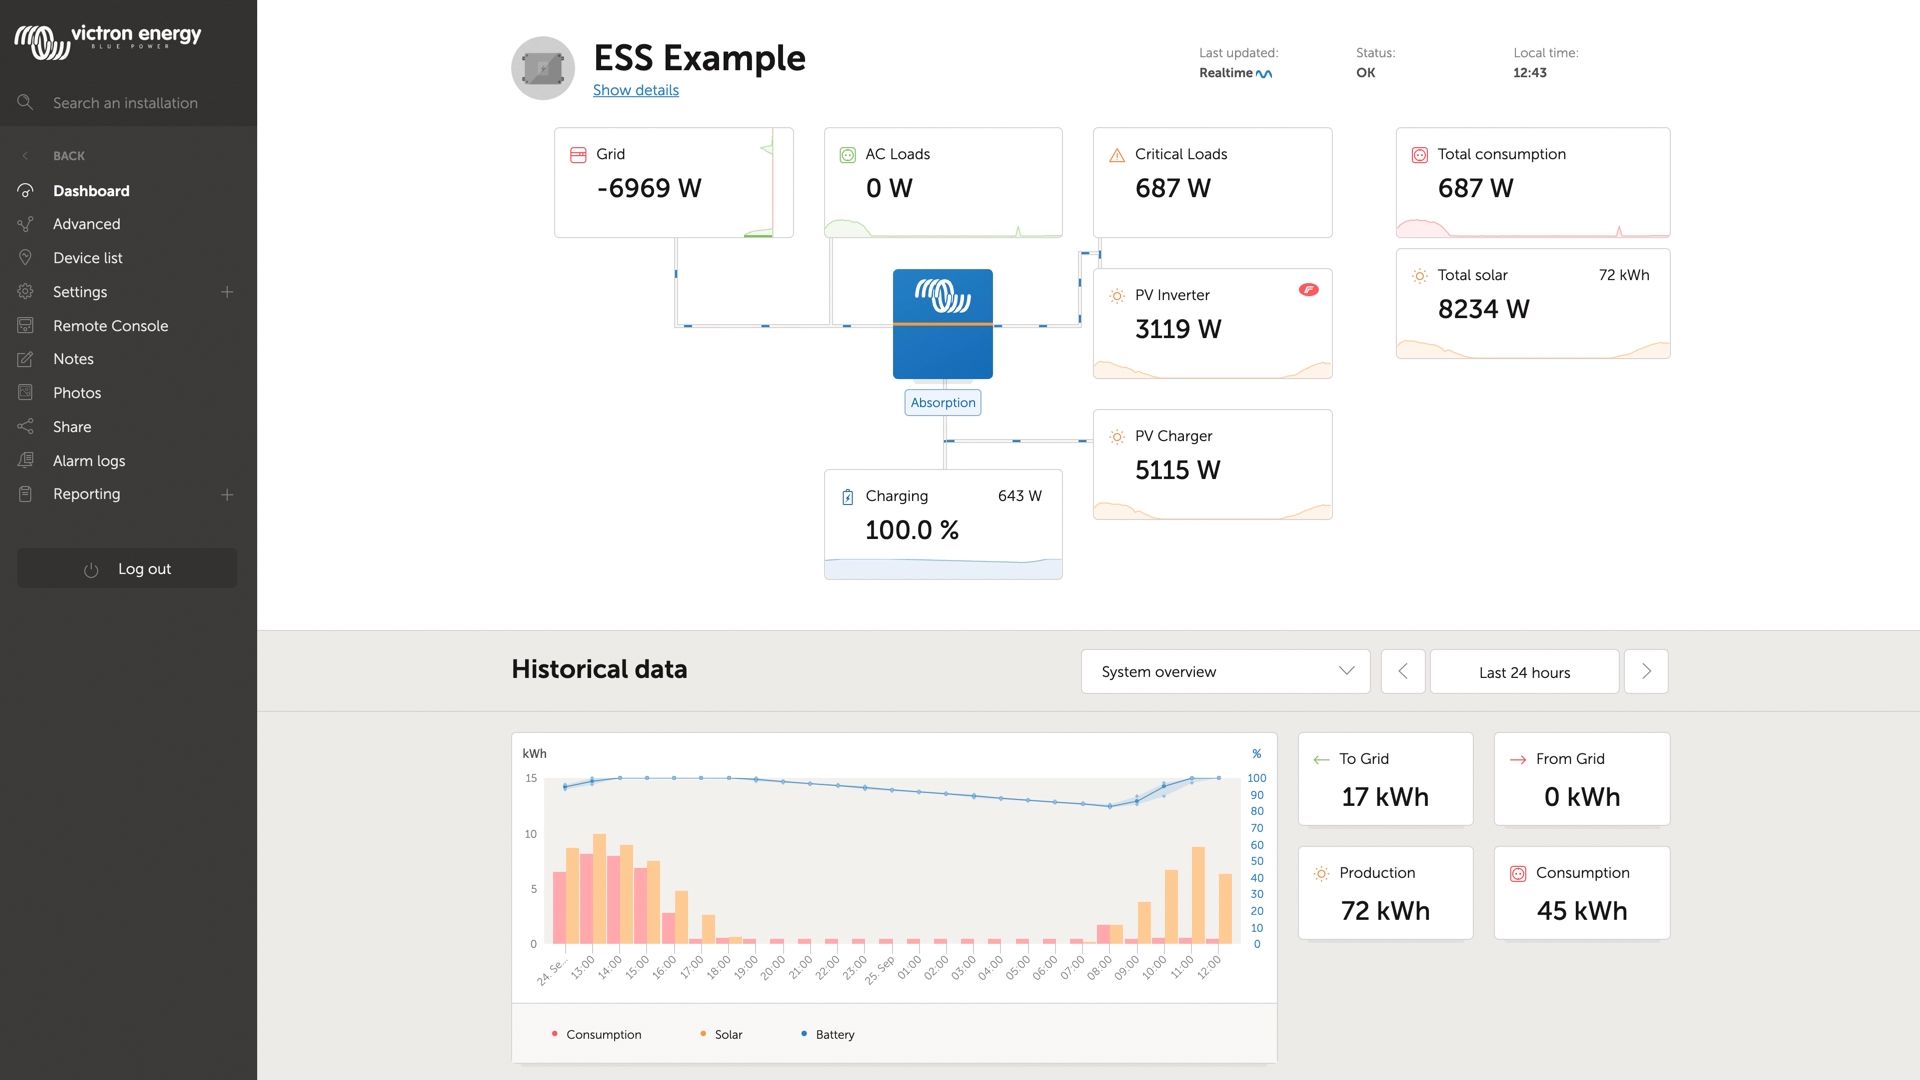
1.3 Example screenshot for ESS installation
1.4 Example screenshot for Off-grid installation

1.5. Details per section
1.5.1 Schematic visualisation

The information shown adapts itself to the system installed. For systems without an inverter/charger, separate blocks of information are shown, without connected lines and 'moving ants'.
1.5.2 Battery block

The purpose of this part of the dashboard is to show all available batteries, for installations having multiple batteries. For example a yacht, having two main engines (and thus two starter batteries for them), another starter battery for a generator, and two service batteries.
For each of the configured battery, the VRM Portal will show its name, the voltage, current, and state of charge.
Configuration:
- Configure the battery settings on the GX Device, in the Menu → Settings → System Setup → Battery Measurements
- Meet all the requirements for the Real time feature, as this information is only available when in Real time mode. See Chapter 2.
- Two or more batteries must be configured. If there is just one, then the information is already shown as part of the main system overview.
This is the main configuration menu:
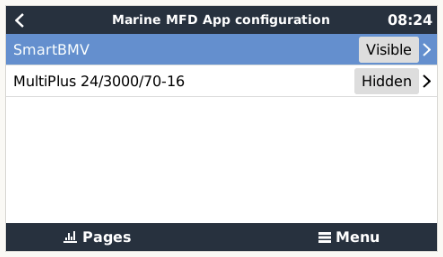
It lists all available battery measurements. Including battery monitors, but also a simple voltage measurement by a solar charger or battery charger for example. For a three output charger, it will list all three measured voltages.
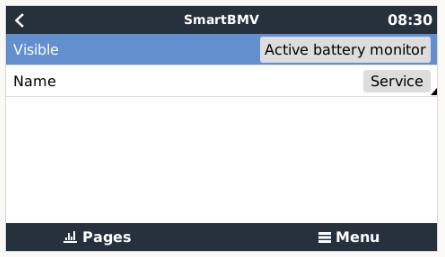
The GX Device allows configuration of each of the available battery measurements:
- to hide or show it
- to name it
Screenshot of detailed menu:
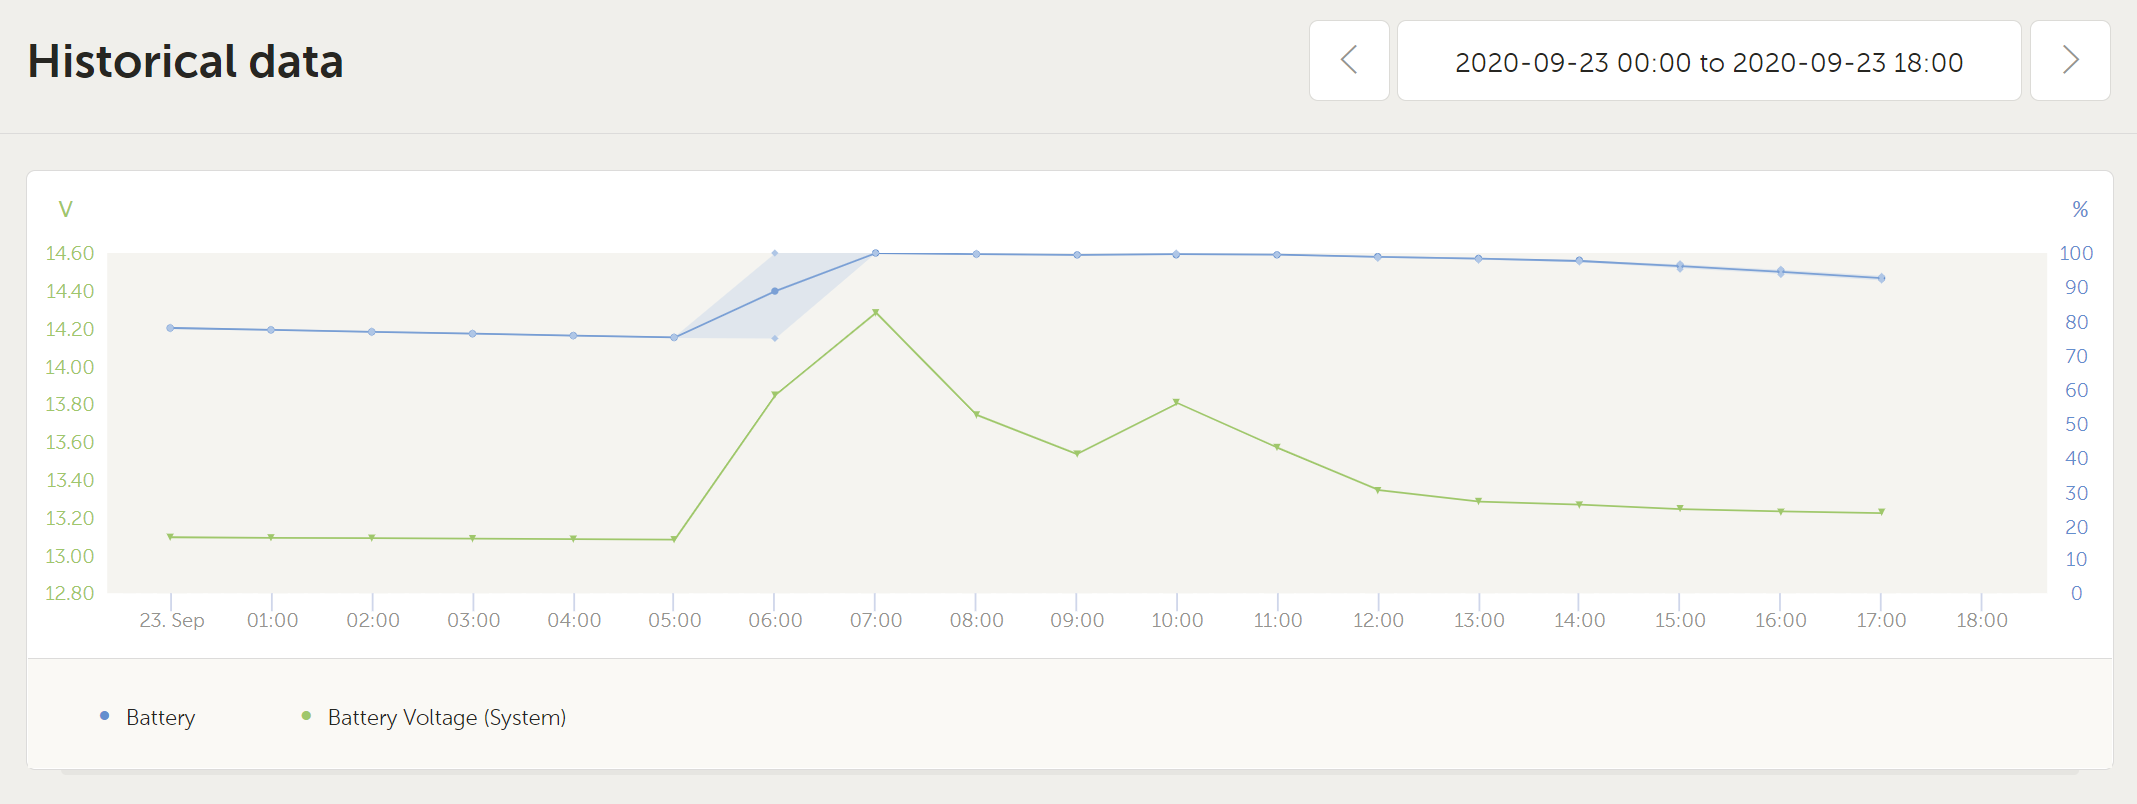
1.5.3 Historical data
Depending on available information, this block will either show a bar graph for kWh production and consumption, together with a blue line showing state of charge, like so:

Or, in case that information is not available, it will show a line diagram. The parameters used in the line diagram depend on the products installed:
- Battery monitor (BMV, SmartShunt or similar): Voltage on the left axis and SOC on the right access
- Inverter: Output power on the left axis, Battery voltage on the right axis
- Solar Charger: Output power on the left axis, Battery voltage on the right axis.
Requirements for the kWh production and consumption data are explained VRM Portal - Frequently asked questions.
Screenshot of an installation with only an Inverter, thus showing the line diagram:
2. Real time data
2.1 Introduction
The dashboard can show real time data, meaning that every two seconds data updates are sent straight from the installation to your browser - rather than pulled from the database at which the information is stored at the interval configured in Settings → VRM Portal → Interval (default 15 minutes).
The new dashboard increases the GX CPU load. Data usage is also increased. Both the CPU load and data usage are only increased while the dashboard is being observed.
Check the top of the page to see if its in real time mode. Here is a screenshot when using real time data:

And here is a screenshot of a system not using real time data:

2.2 Disabling the realtime data feature
It is possible to disable the realtime data feature in the VRM → Select Installation Site → Settings → General → Realtime updates green(on) / red(off).
Examples of when you want to disable real time data are:
- To keep data usage to a minimum, while keeping the VRM Two way communication setting enabled to be able to remotely configure & firmware update
- For systems where CPU load is already at the edge of what is possible, so rather than each time waiting for it to be automatically disabled (see below), and thus also having a short time of high CPU load on the system, disable it permanently.
2.3 Requirements
- A GX Device, with Venus OS v2.60 or later
- Good internet connection
- Sufficient CPU resources (see below)
- Settings → VRM Portal → Two way communication must be enabled

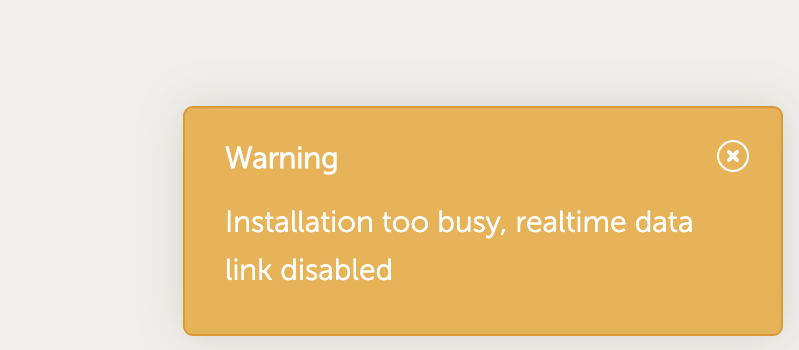
2.4 GX Device CPU Load
Transmitting the data to the VRM Dashboard causes an extra load on the CPU in the GX Device. As such, systems already operating at 100% CPU, or close to it, would be overloaded with the result that tasks are left waiting, slow response on Remote Console, slow data updates, and eventually also reboots of the GX Device.
To prevent this, the dashboard will automatically suspend itself in case the CPU load is too high. In which case a warning is shown on the lower right on your screen:
3. Control your devices in VRM
VRM offers control over some of your Victron devices, straight from the VRM dashboard. With this feature, you can quickly adjust the settings ESS or relay switches, without needing to open the remote console.
To access it, head to your VRM dashboard.
In the top right of your installation's dashboard in VRM, beside last update and the local time display, you will find the icon for the controls. The controls modal opens to the right of your screen.
Note: Access to controls requires the 'real time data' connection to your installation.


3.1 Inverter controls in VRM
VE.Bus Inverter controls can be made available on the VRM Dashboard, but require an additional step to enable in the Settings for that specific VRM Installation. This is to prevent accidentally switching off the system.

It is ONLY recommended to enable this easy system shutdown control for small systems in non-critical environments. It is STRONGLY recommended to leave this feature disabled for large mission critical systems, or where there are multiple users with access to the Admin controls.
Once enabled, you can access the settings via the control button.


Note - This feature is only available for VE.Bus models, is not available for VE.Direct, or VE.Can inverters. Also, there is a limitation where these controls are not available when using a Digital Multi Control, or VE.Bus BMS v1 in the system.
3.2 ESS controls in VRM
For your ESS system, you can switch your settings between ESS modes 'Optimized with BatteryLife', 'Optimized without BatteryLife', 'Keep batteries charged' and 'External control'. As with the inverter settings, you will have 5 seconds to cancel any change in settings before it is sent to the device.

You will also be able to adjust the minimum state of charge. Note that setting the minimum state of charge will not be possible when the ESS is set to 'keep batteries charged' as that mode will override and charge the battery to 100% when possible.

3.3 Manual relay controls in VRM
This functionality is not yet available.
We are currently working on enabling toggling manual relays on and off from the controls panel in VRM. We plan to release this in Q3 of 2022.
3.4 Generator controls in VRM
This functionality is not yet available.
We are currently working on enabling you to also control your generator from your VRM dashboard. You would then be able to start or stop the generator, or start a timed run for it. We plan to release this in Q3 of 2022.