This is an old revision of the document!
−Table of Contents
VRM Portal - Dashboard
1.Introduction & available information
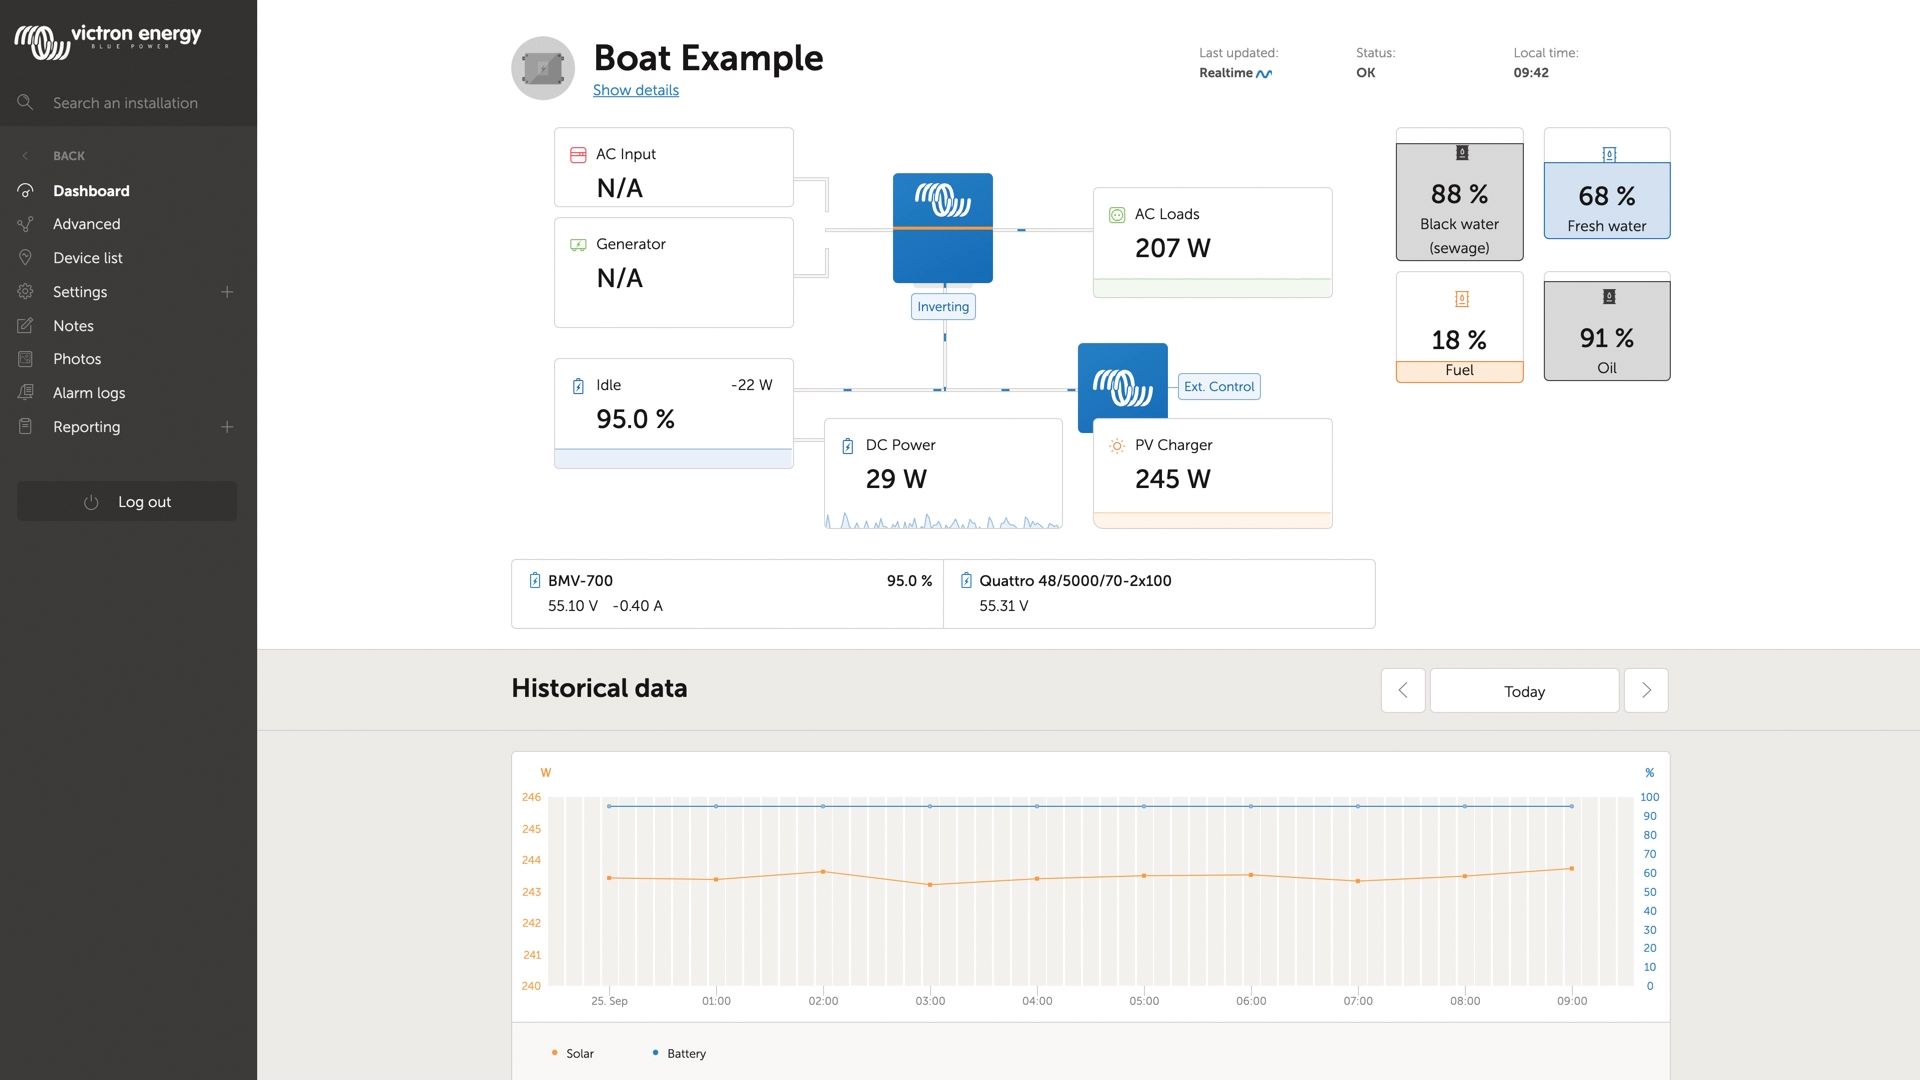
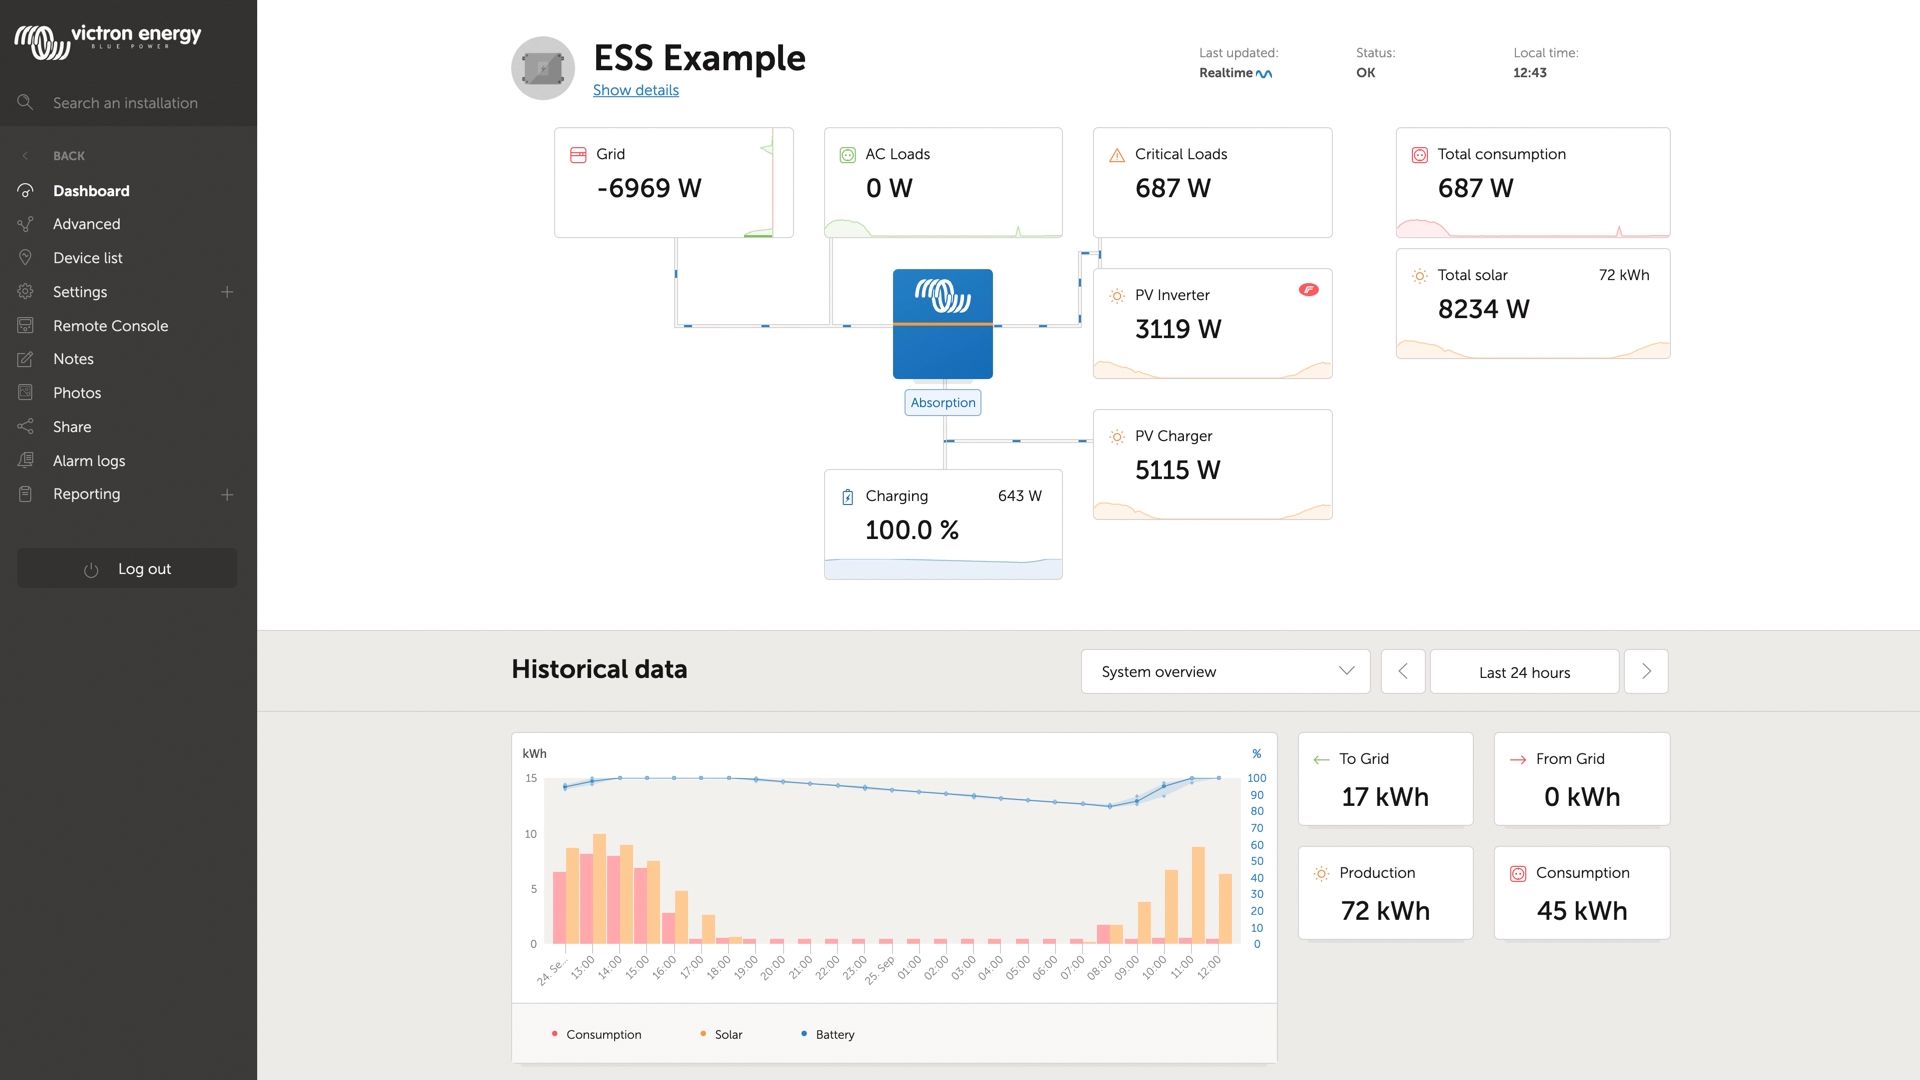
The dashboard is the main page. It shows all information an installation at a glance. The information available automatically adopts itself to the system.
TODO ADD VIDEO ONCE RELEASED.
A number of screenshots showing the different options:
1.1. Details per section
1.1.1 Schematic visualisation
TODO add screenshot.
1.1.2 Battery block
TODO add screenshot.
Intended for installations with multiple batteries. For each battery the system shows its name, the voltage, current as well as state of charge.
To see this information, the following must be done:
- Configure the battery settings on the GX Device, in the Settings → System Setup → Marine MFD App menu - Meet all the requirements for the Real time feature, as this information is only available when in Real time mode. See Chapter 2.
1.1.3 Historical data
Depending on available information, this block will either show a graph showing bars for kWh production and consumption together with a blue line showing state of charge, like so:
TODO ADD SCREENSHOT
Or, in case that information is not available, it will show a line diagram. On the left Y-axis, TODO COMPLETE THIS BY TEUN.
On the right Y-axis will show battery state of charge when available. And if not, then battery voltage.
Requirements for the kWh production and consumption data are explained VRM Portal - Frequently asked questions.
2. Real time data
2.1 Introduction
The dashboard can show real time data, meaning that data updates every two seconds and is sent straight from the installation to your browser. Rather than pulled from the database at which the information is stored at the interval configured in Settings → VRM Portal → Interval (default 15 minutes).
2.2 Requirements
- A GX Device, with Venus OS v2.60 or later
- Good internet connection
- Settings → VRM Portal → Two way communication must be enabled
- Sufficient CPU resources (see below)
2.3 GX Device CPU Load
Transmitting the data to the VRM Dashboard causes an extra load on the CPU in the GX Device. As such, for systems already operating at 100% CPU, or close to it, would be overloaded. Meaning that tasks are waiting, visible by slow response on Remote Console, slow data updates, and eventually also reboots of the GX Device.
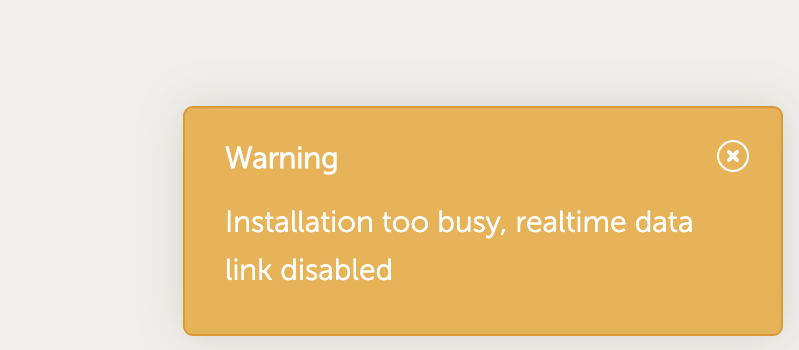
To prevent this, the dashboard will automatically suspend itself in case the CPU load is too high. In which case a warning is shown on the lower right on your screen:

 Add this page to your book
  Remove this page from your book
  Manage book (
 Help
Help 
