7. Monitoring
This chapter describes all various monitoring methods and for each method how to access live data, historic data and errors.
7.1. LED indications
The solar charger has three LEDs to indicate operational status, a blue, green and a yellow LED. These LEDs respectively indicate the charge stages bulk, absorption and float, but are also used to indicate other charge situations and fault situations.
Errors are indicated via a combination of LEDs that are on, off, or are blinking. Each LED combination has a meaning, indicating either a normal operation mode, or indicating an error.
Symbol | Meaning | |
|---|---|---|
| Permanent on | |
| Blinking | |
| Off |


Overview of LED indications:
Operation mode | Bulk LED | Absorption LED | Float LED | |||
|---|---|---|---|---|---|---|
Not charging 1 |
|
|
| |||
Bulk1 |
|
|
| |||
Absorption2 |
|  |
| |||
Manual equalisation (alternating blinking)2 |
|  |
| |||
Automatic equalisation2 |
|
|
| |||
Float2 |
|
|
|


The bulk LED will blink briefly every 3 seconds when the system is powered but there is insufficient power to start charging.
The LED(s) might blink every 4 seconds indicating that the charger is receiving data from another device, this can be a GX device (ESS) or a VE.Smart Network link via Bluetooth
Fault mode | Bulk LED | Absorption LED | Float LED | |||
|---|---|---|---|---|---|---|
Charger temperature too high |
|
|
| |||
Charger over-current |
|
|
| |||
Charger or panel over-voltage |
|
|
| |||
VE.Smart networking or BMS issue |
|
|
| |||
Internal error, calibration issue, settings data lost or current sensor issue. |
|
|
|

For the latest and most up-to-date information about the LED blink codes, refer to the Victron Toolkit app. The app is available for Apple and Android. The app can be downloaded from the respective app stores or alternatively follow the download links on our software downloads page.
7.2. Error codes
In case of an error, an error code will be displayed in the following ways:
Via its LEDs.
Via the VictronConnect app while it is connected to the solar charger.
Via an optional MPPT control or SmartSolar Control display.
Via an optional GX device or GlobalLink 520 and the VRM Portal.
For the meaning of blinking LED codes, see the previous chapter or the Victron Toolkit app.
For a full list of error codes and their meaning see the Error code overview chapter.
7.3. Monitoring via the VictronConnect app
The VictronConnect app can be used to monitor the solar charger, see its historical values and if there are operational warnings or errors.
This chapter explains the solar charger-specific VictronConnect app usage. Refer to the general VictronConnect app manual for information about the VictronConnect app itself, such as: how to install the app, how to connect to the solar charger, how to update firmware and more.
Note
Where battery voltage is referred in this chapter, a 12V battery is assumed.
To arrive at values for 24V, 36V or 48V batteries, multiply the 12V values by a factor of 2, 3 or 4 respectively.
7.3.1. VictronConnect app status screen
The status screen displays the solar charger model name together with the live solar charger information.
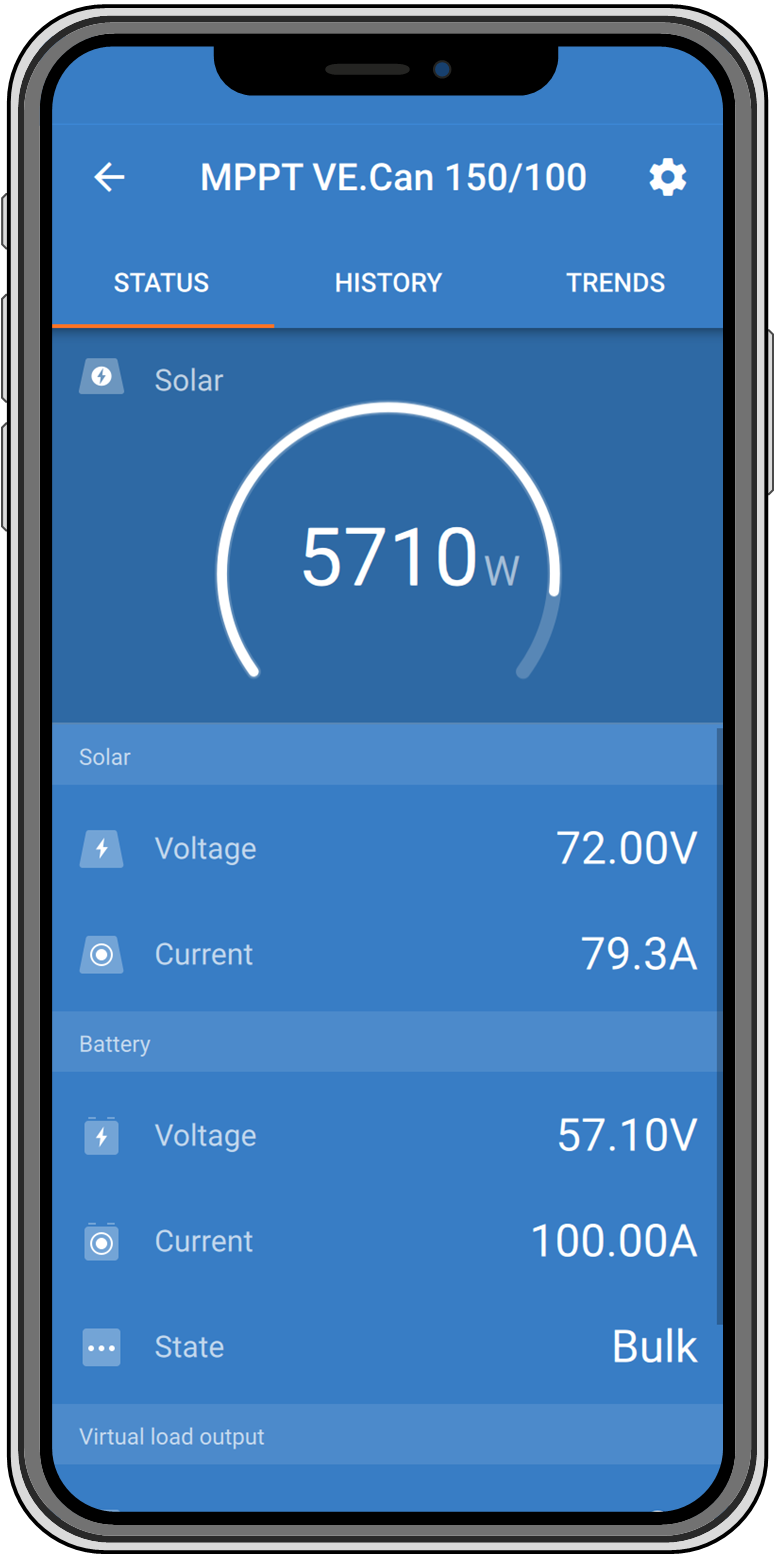 |
VE Smart Networking
The presence of the VE.Smart Networking symbol
 indicates that the solar charger is configured for VE.Smart Networking and is receiving battery temperature and/or battery voltage data from the VE.Smart Network.
Solar
The solar gauge shows the solar output in relation to the maximum output power that the solar charger can generate at the set battery voltage and displays the dynamic real-time value of the solar array output power.
The solar voltage measured at the solar terminals of the solar charger.
The solar current flowing from the PV array into the solar charger.
Battery
The battery voltage measured at the battery terminals of the solar charger.
The current flowing from the solar charger into the battery.
The battery state indicates the battery charge stage or if external control is active. These are the possible states:
Bulk
During this stage the solar charger delivers as much charge current as possible to rapidly charge the batteries. When the battery voltage reaches the absorption voltage setting, the solar charger activates the absorption stage.
Absorption
During this stage the solar charger switches to the constant voltage mode, where a pre-set absorption voltage is applied. When the charge current decreases below 2A or if the pre-set absorption time has elapsed, the battery is fully charged and the solar charger will enter the Float stage. Note that when an automatic equalisation is being performed this will also be reported as absorption.
Float
During this stage the float voltage is applied to the battery to maintain a fully-charged state. When the battery voltage drops below float voltage during at least 1 minute, a new charge cycle will be triggered.
External control
This will be displayed when another device is controlling the charge behaviour of the solar charger, bypassing its normal charge algorithm. Examples are when the solar charger is controlled by an ESS system or a managed battery.
In case the charger is not charging a "Why is the charger off?" message will display. When clicking on this message, a new window will open with more information as to why the solar charger is not charging.
Virtual load output
The state of the virtual load output, being switched on or switched off.
Relay
The state of the relay, being open or closed.
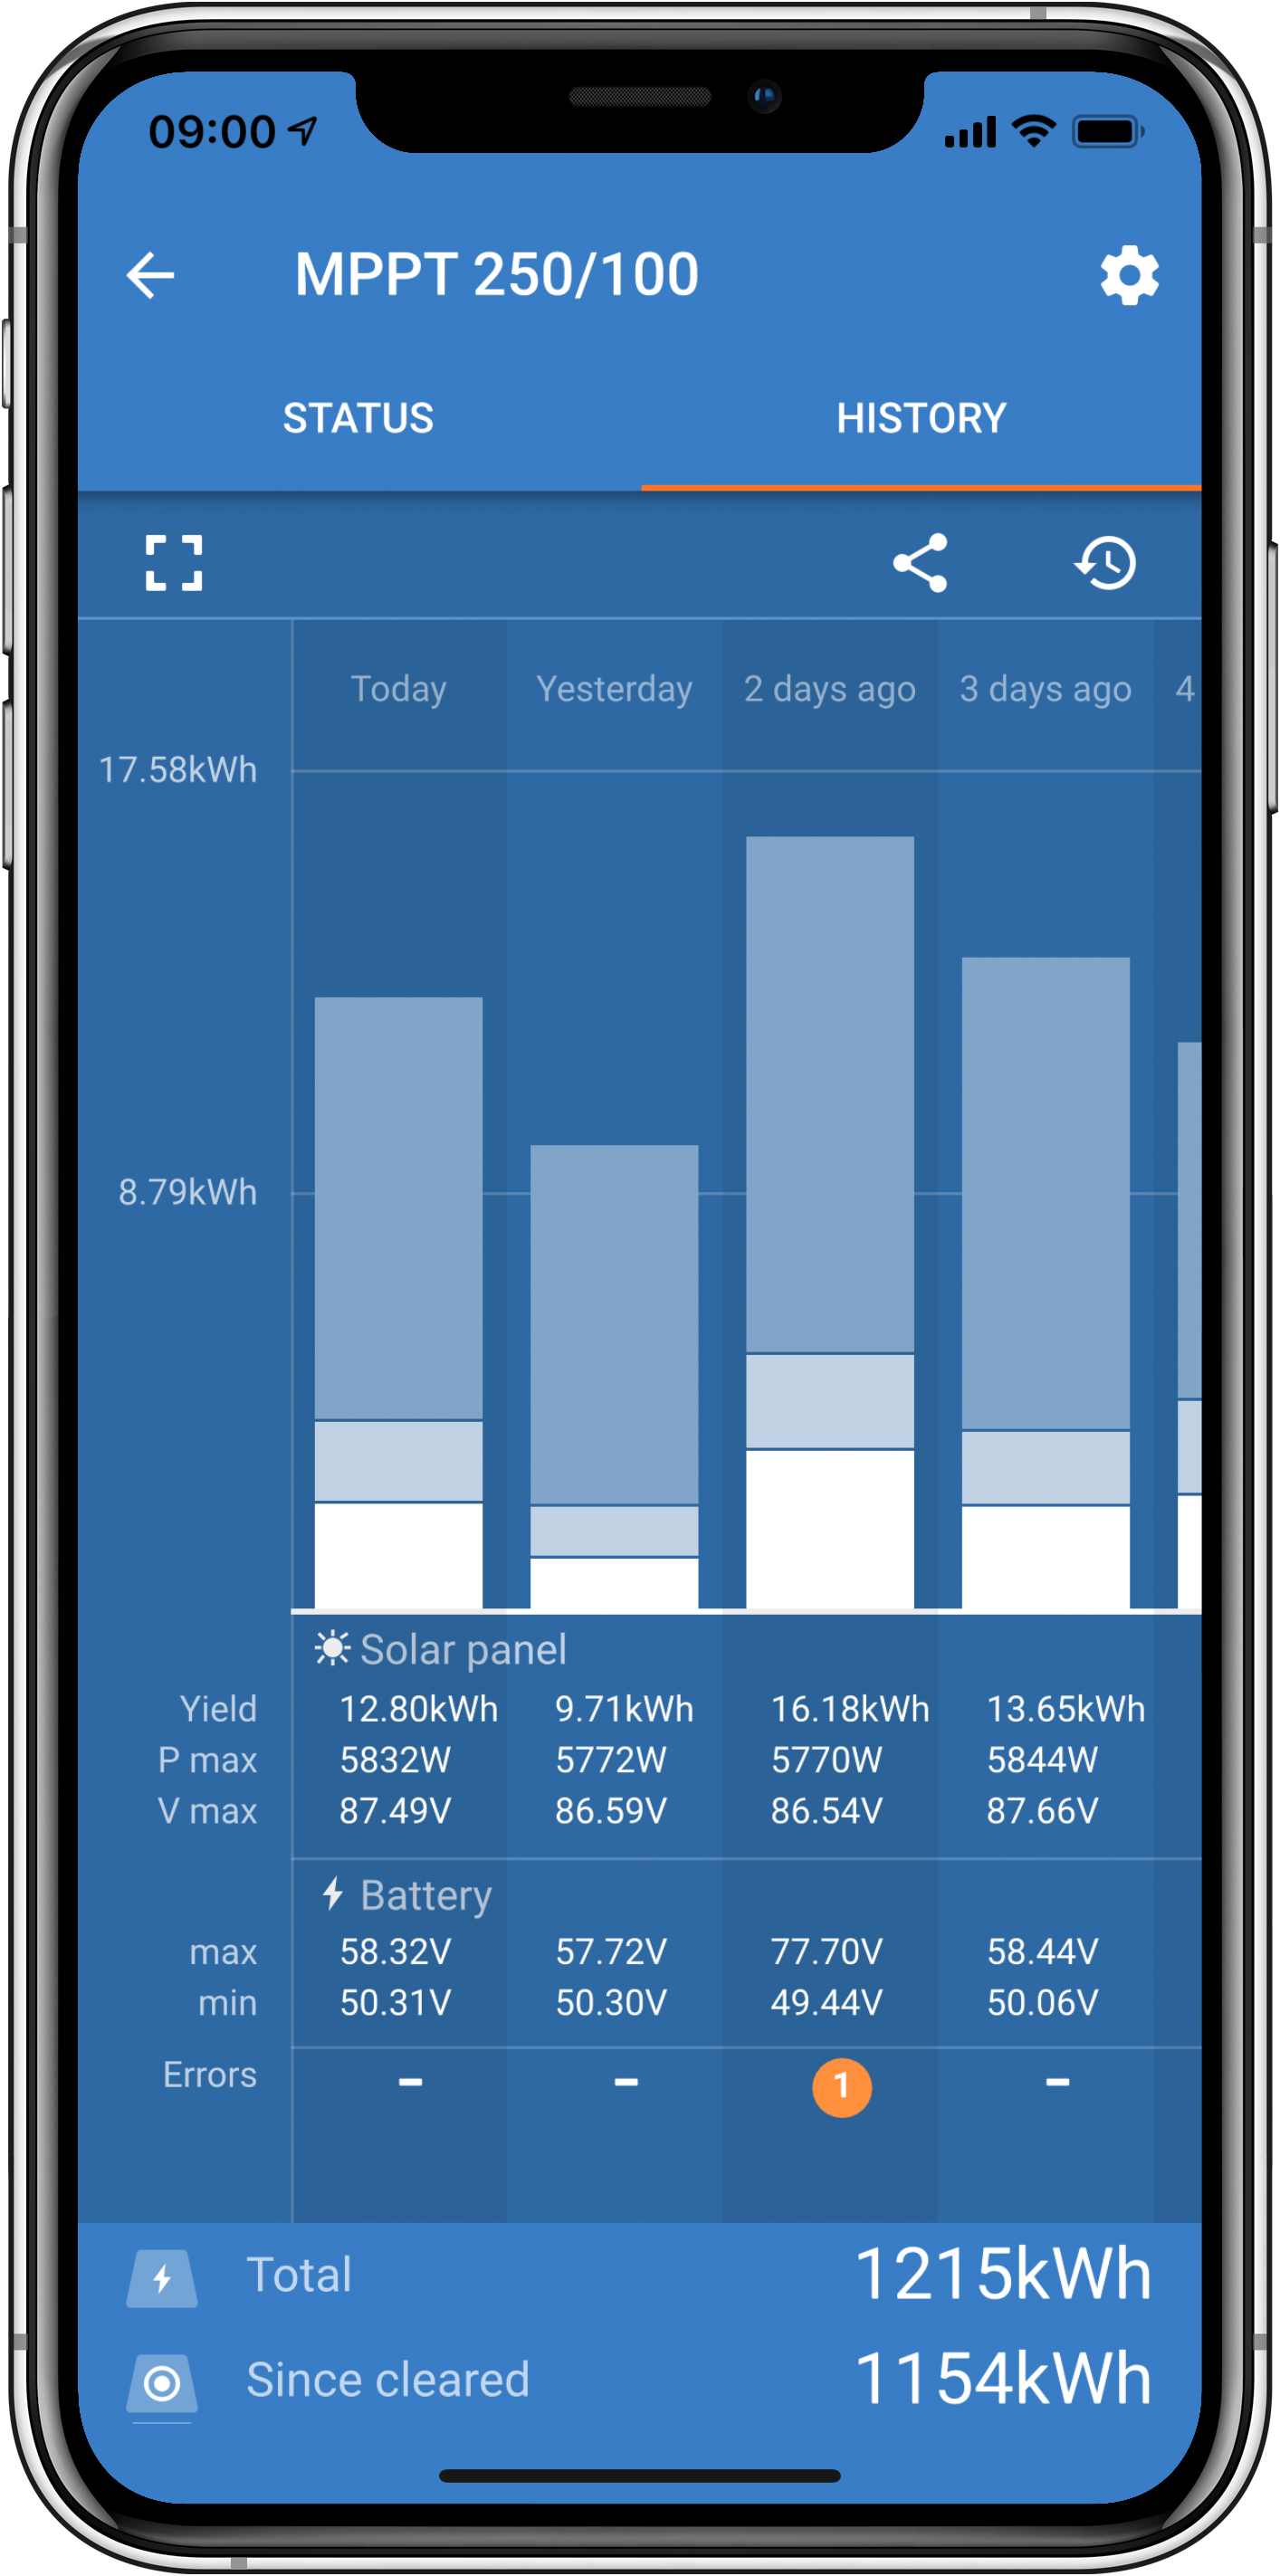
7.3.2. VictronConnect app history screen
The history screen shows a summary of the data collected over the previous 30 days. Swipe the screen to the right or left to show any of the 30 days.
 |
To switch between portrait or landscape screen presentation click the fragmented square icon,  or
or  , at the top left of the screen.
The daily log shows:
Solar yield: The energy (Wh) converted for that day.
Solar Pmax: The maximum power (W) recorded during the day.
Solar Vmax: The highest voltage (V) from the PV array during the day.
Battery max and min: The first figure shows the maximum battery voltage (Vmax) for the day. The figure below is the minimum battery voltage(Vmin) for the day.
Errors: This shows the daily number of errors, if any. To get more information about the error(s), click the orange dot. You may need to slide the display on your device up to see the errors.)
Lifetime total: This shows the total energy converted by the installation (W and is not re-settable).
Since reset: This shows how much energy has been converted by the installation since the last reset.
Clicking on any bar (day) in the graph will expand the information. It will show the time and percentage of the total charge time that the solar charger has spent in each Bulk, Absorption and Float charge stage.
Tip
You can use the charge times to see if the PV array is properly sized for your requirements. A system that never reaches the float stage may need more panels. Or perhaps the load should be reduced?
The history can be exported as a comma-separated file (CSV) by clicking the three connected dots symbol  or the save symbol
  at the top right of the history screen. The symbol varies, depending on what platform VictronConnect is used.
The history can be reset by clicking the clock with an arrow symbol  at the top right of the history screen.
7.3.3. VictronConnect app error reporting
The VictronConnect app will indicate active errors while the app is actively connected to the solar charger. The error will show up in a pop-up window on the status screen together with the error number, name and a short error description.
The VictronConnect app also displays historical errors. To see these errors, navigate to the “History” tab and look at the bottom of each day column. An orange dot will indicate an error on that day.
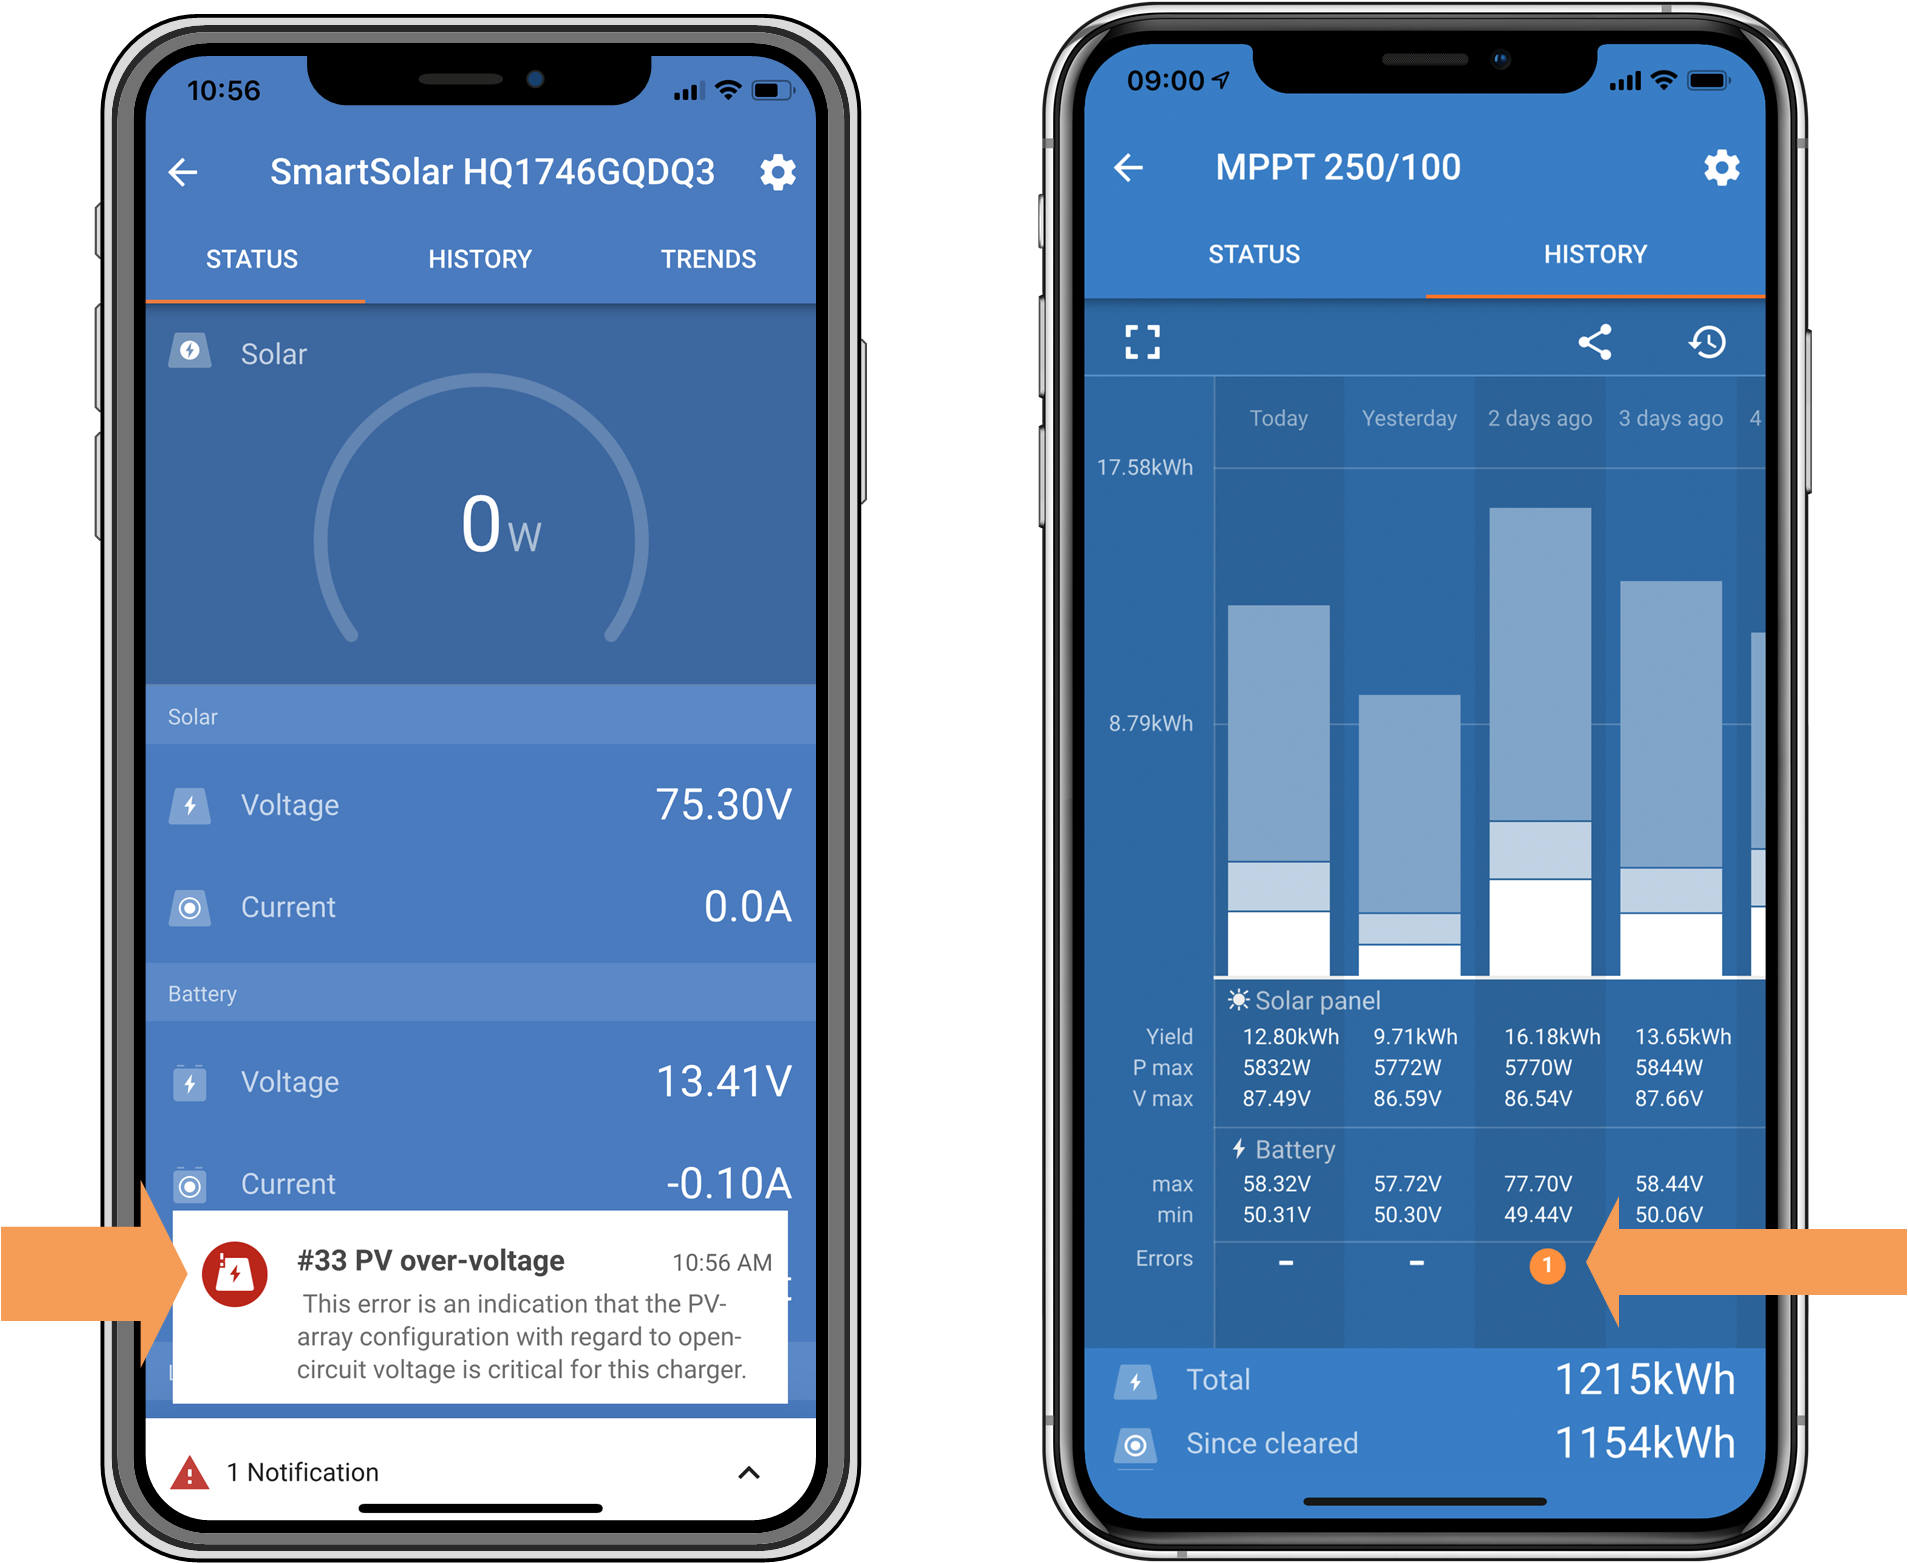 |
An active error and a historical error.
7.4. Monitoring via a GX device and VRM
If the solar charger is connected to a GX device, all its data can be accessed via the GX device. The GX device will also notify in case of solar charger alarms or faults.
For more information see the GX device manual.
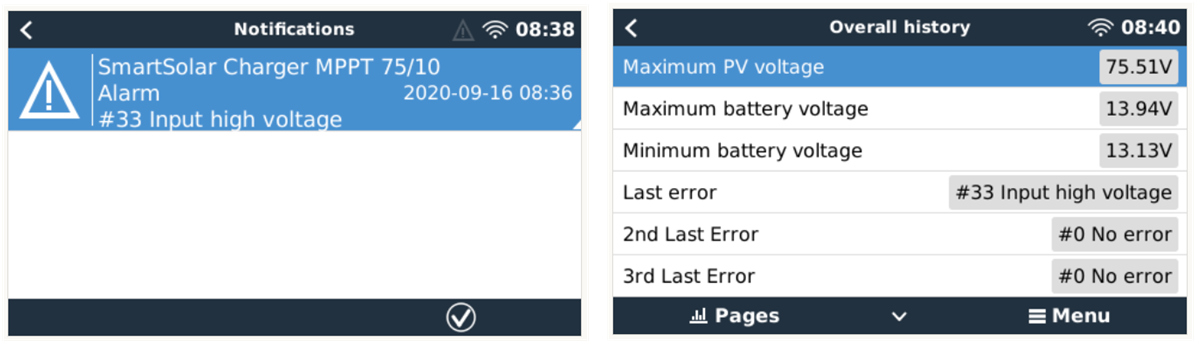 |
GX device showing alarm notification and historic errors.
If the GX device is connected to Victron Remote Monitoring (VRM) portal, the solar charger can be monitored remotely via the internet.
All solar charger data, alarms and errors can be accessed via the VRM portal and solar charger settings can be remotely changed via the VRM portal with the VictronConnect app.
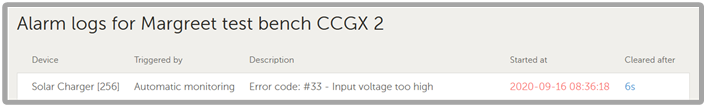 |
Solar charger alarm logging via VRM