Add this page to your book
  Remove this page from your book
  Manage book (
 Help
Help This is an old revision of the document!
Table of Contents
VRM Portal - Dashboard
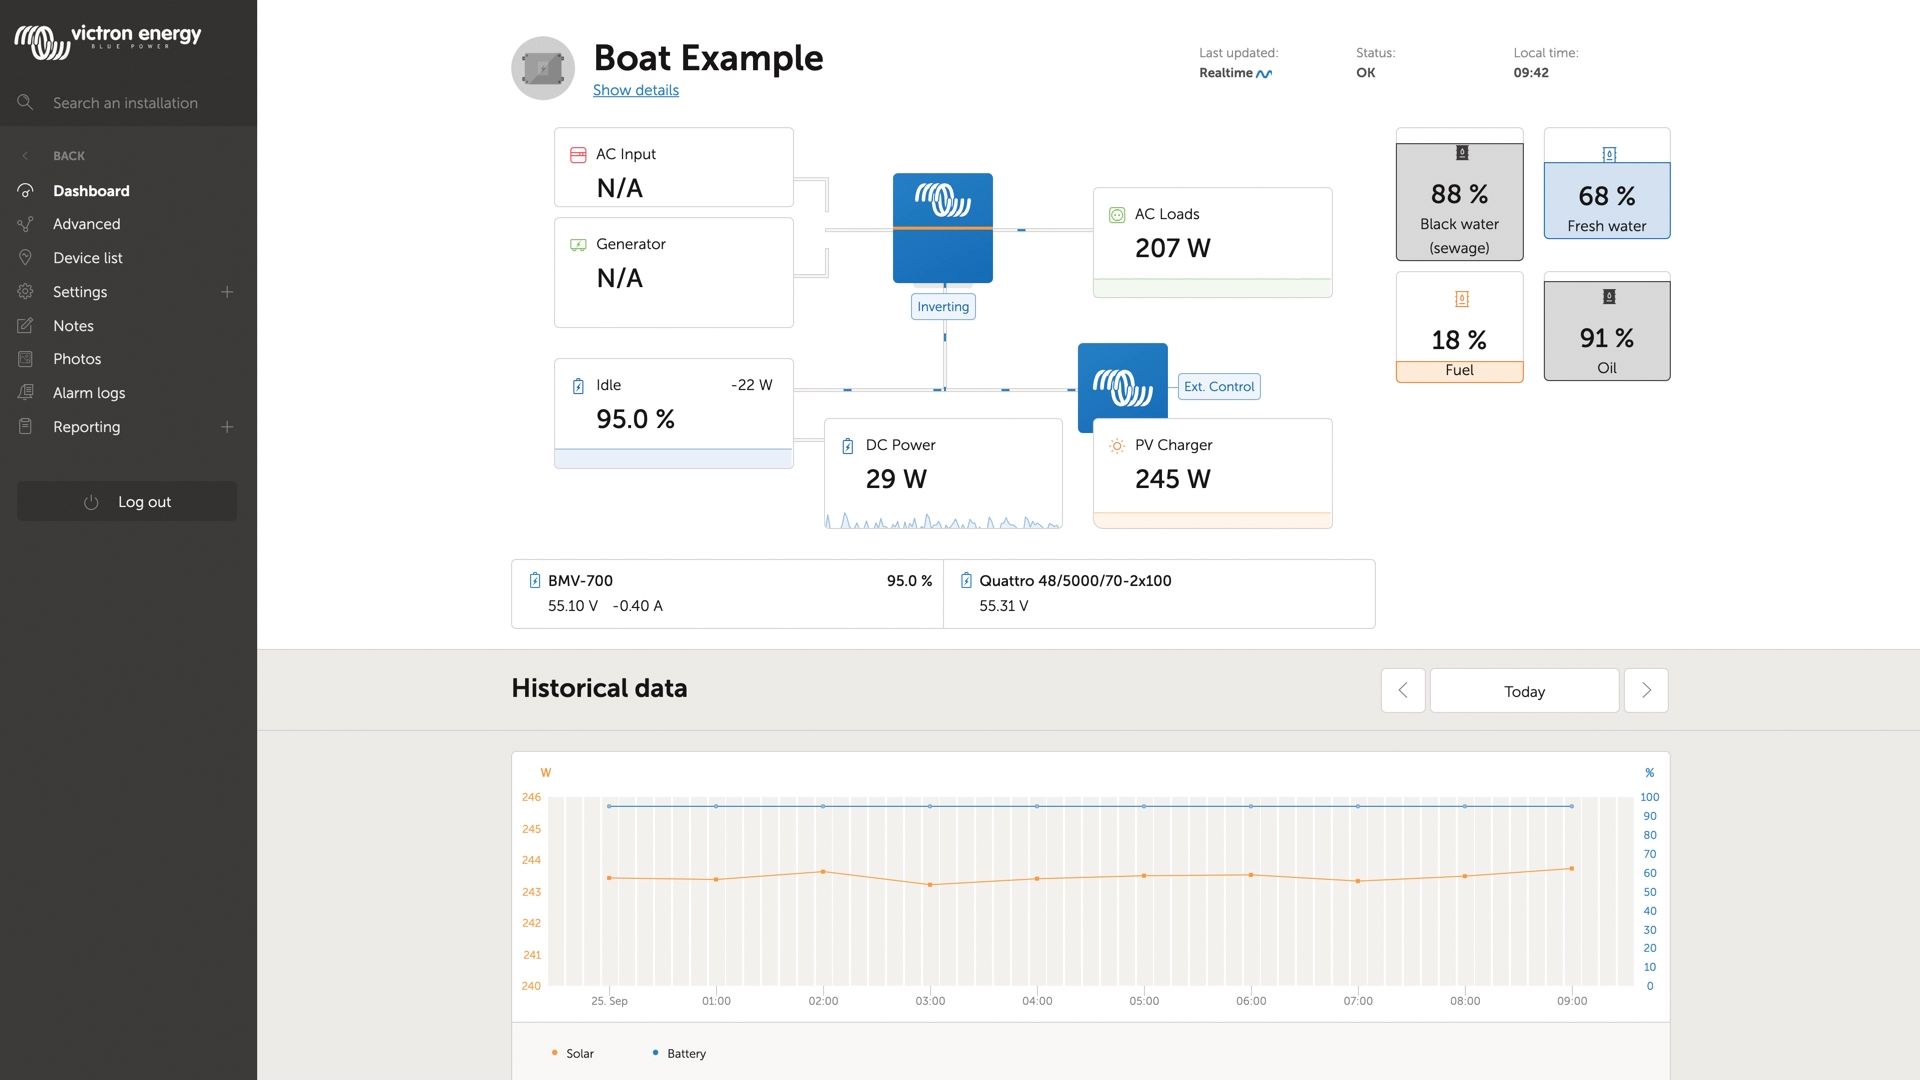
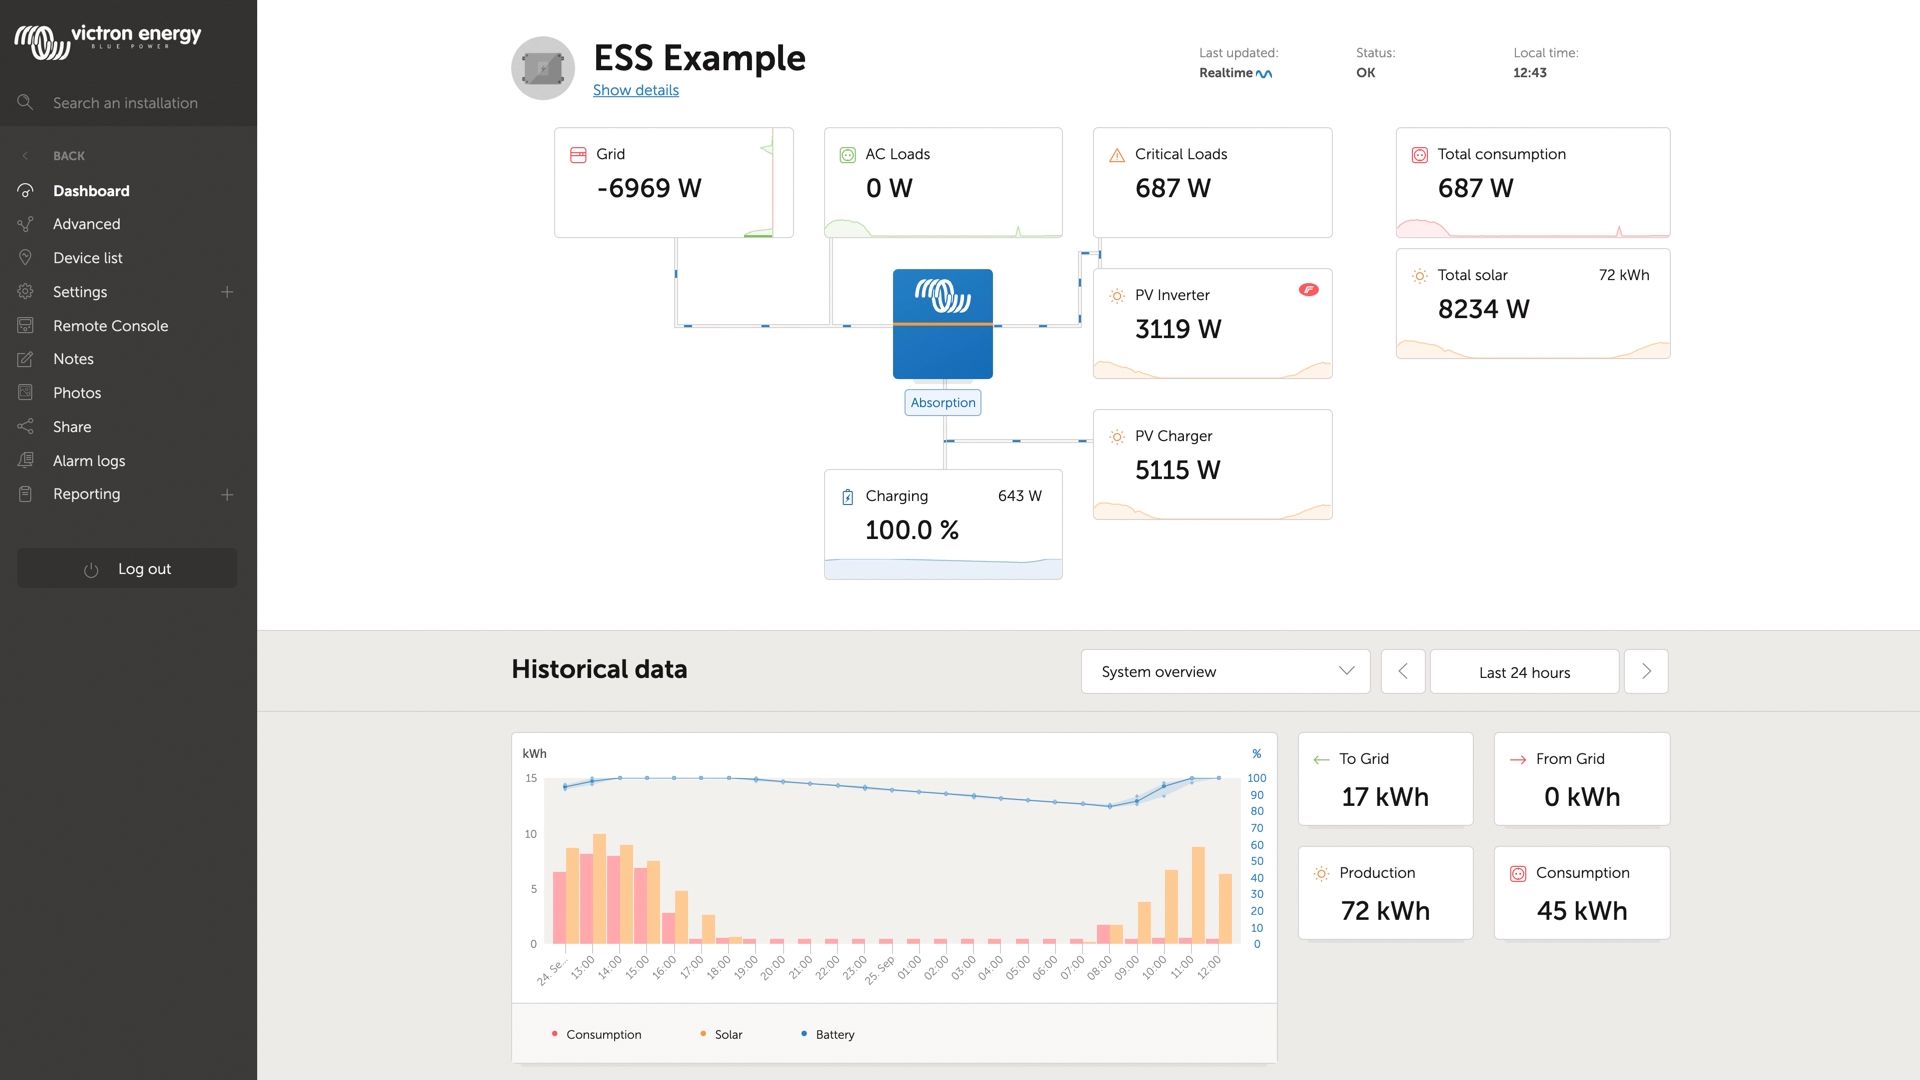
The dashboard is the page on VRM that shows all information of your installation at a glance. The information available automatically adopts itself to the system.
A number of screenshots showing the different options:
Real time data
Introduction
The dashboard can show real time data, meaning that data updates every two seconds and is sent straight from the installation to your browser. Rather than pulled from the database at which the information is stored at the interval configured in Settings → VRM Portal → Interval (default 15 minutes).
Requirements
* A GX Device, with Venus OS v2.60 or later * Good internet connection * Settings → VRM Portal → Two way communication must be enabled * Sufficient CPU resources (see below)
GX Device CPU Load
Transmitting the data to the VRM Dashboard causes an extra load on the CPU in the GX Device. As such, for systems already operating at 100% CPU, or close to it, it will be overloade. Meaning that tasks are waiting, visible by slow response on Remote Console, slow data updates, and eventually also reboots of the GX Device.
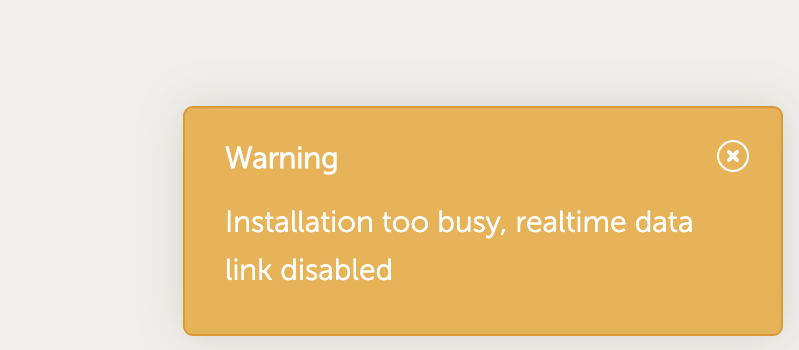
To prevent this, the dashboard will automatically suspend itself in case the CPU load is too high. In which case a warning is shown on the lower right on your screen: